
Releasing the Pressure: Cultivating Graphite Value Chains in an Expanding Market
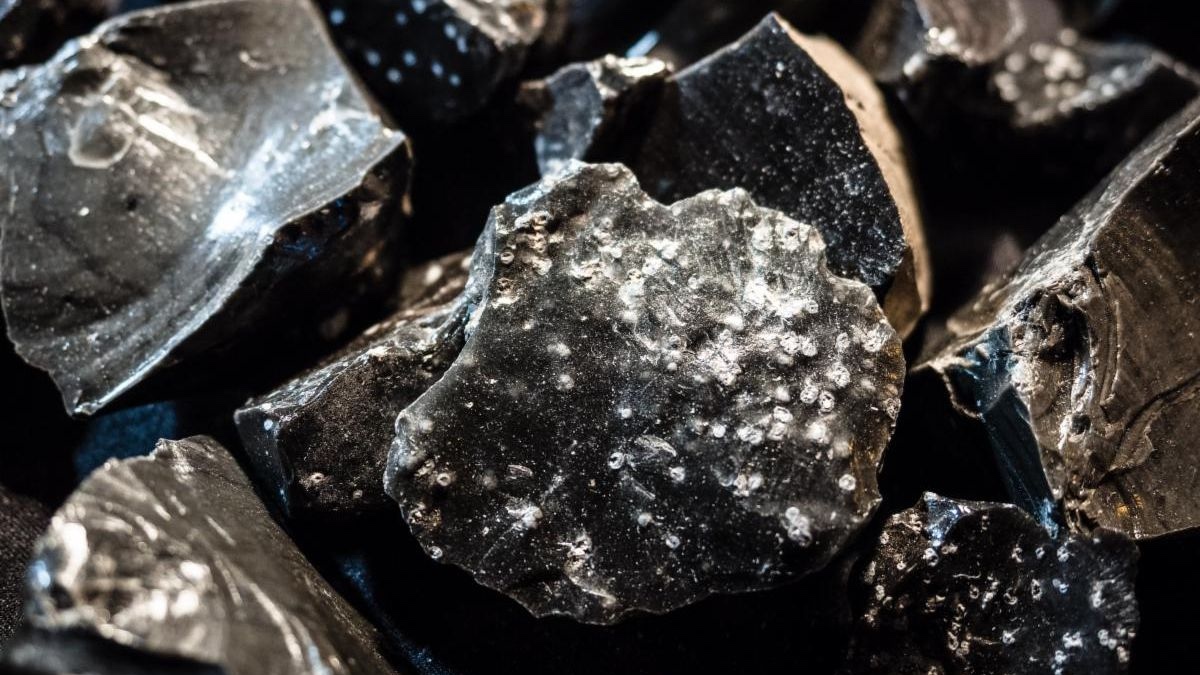
Graphite is carbon in its crystalline form. With its distinctive electrochemical properties, it forms anodes in lithium-ion batteries (LIBs), ensuring that they have stable charge and discharge cycles. Globally, as countries rely increasingly on electric power, the demand for LIBs—and therefore graphite—will be driven by both in-vehicle batteries and stationary energy storage. As nations choose where to invest, care must be taken to ensure that negative social and environmental impacts are avoided and that geopolitical concerns are carefully managed.
Graphite demand will soar in the decade ahead. We expect a compound annual growth rate (CAGR) of 11.6% between 2022 and 2035, with global demand of around 7,334 kt in 2035—4.2 times higher than in 2022. We estimate that the proportion of demand related to LIBs will grow from 36% in 2022 to 78% in 2035.
Demand for both natural and synthetic graphite has risen in recent years as end-user markets for LIBs have expanded, putting significant pressure on supply and value chains. Global reserves and ore quality of natural graphite are high, but mining operations are not well-developed in all locations with mineral deposits. Most natural graphite is sourced from mines in the Global South—especially Mozambique and Madagascar—while synthetic graphite is primarily produced in China.
Major world economies such as the United States (US), the European Union, China, and India have listed natural graphite as a critical mineral. In October 2023, China restricted exports of graphite suited for electric vehicle battery production. As China exports more graphite than any other country, graphite has quickly become a focal point in global supply chain conversations.
Our recent report on graphite discusses value chains, anticipated increases in demand, and highlights the need for equity considerations while expanding mineral availability.
Our Key Findings are:
- China dominates graphite production and exports. As of 2022, China holds the largest market share of graphite production at 62%, followed by Mozambique at 12%, Madagascar at 8%, Brazil at 6%, and India at 4%. Between 2019 and 2022, there was a significant increase in natural graphite production in Mozambique, Madagascar, and Tanzania in Africa, as well as in India in South Asia.
China is now the dominant exporter of natural and synthetic graphite. However, its share of global natural graphite exports declined from 50% in 2019 to 44% in 2022, while its share of synthetic graphite increased from 60% in 2019 to 77% in 2022.
- Mineral Security Partnership (MSP) countries are net importers. Although Germany, the US, and Canada are the top graphite exporters amongst MSP countries, each are net importers—and each relies on China (Figure 1). These MSP countries don’t have natural reserves, so exports include material that is first imported from other countries and then re-exported. Graphite originating in China may appear as coming from elsewhere if it passes through other countries. Germany is an exception as a net exporter of synthetic graphite. Australia, Canada, and India could become exporters of natural graphite, given their estimated reserves. In the US, the use of synthetic graphite may emerge as a solution to attain compliance with the Inflation Reduction Act and reduce import dependence.
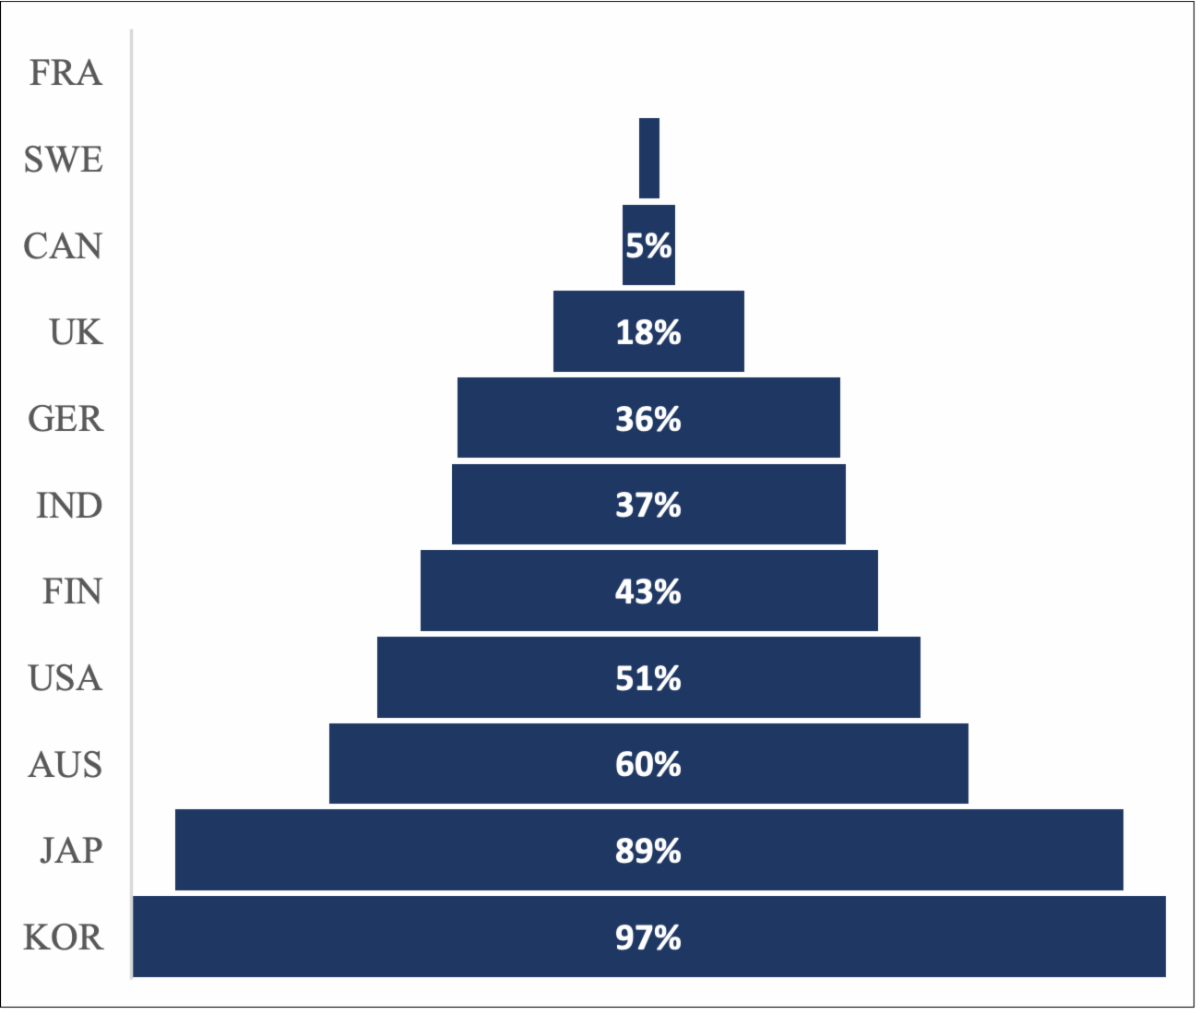
Figure 1: Share of natural graphite imports directly from China, by country. South Korea and Japan exhibit the highest dependence on China followed by Australia, the US, and Finland.
- Trade value of natural and synthetic graphite has increased significantly. Price per tonne for both natural and synthetic graphite varied from $90 to $9,113 (US dollars) between 2019 and 2022. China has seen a 12% CAGR in export value over that period. Natural graphite import cost in the US has risen at 22% CAGR, reaching $2,180/tonne, while Canada saw synthetic graphite import cost increase by 15% CAGR, reaching about $2,200/tonne in 2022. India, France, Sweden, and Finland saw increases of up to 7% CAGR.
- Geographical concentration of mine ownership is the primary factor limiting graphite supply, raising concerns of availability and criticality. The ore quality of most of the 68 mines we evaluated met the criticality threshold. These mines are in Europe, America, Asia, and Africa. Despite broad geographical distribution, ownership of graphite production is concentrated in a handful of countries.
We assessed 60 mines operated in Africa, America, Asia, and Europe. They are controlled by 41 privately owned companies, primarily headquartered in Australia (22 mines), the UK (12 mines), Canada (7 mines), and Brazil (5 mines).
- Modelled graphite demand scenarios point to opportunity for MSP countries. Graphite export restrictions were recently adopted by China. To explore potential impacts, we modelled a 50% reduction in China’s global graphite production, shifting from a 62% market share (as in 2022) to 31%. The result is an opportunity for diversification among MSP network countries. In this scenario, Mozambique, Madagascar, Tanzania, Brazil, and India emerge with market shares of 23%, 15%, 12%, and 8%, respectively (Figure 2).
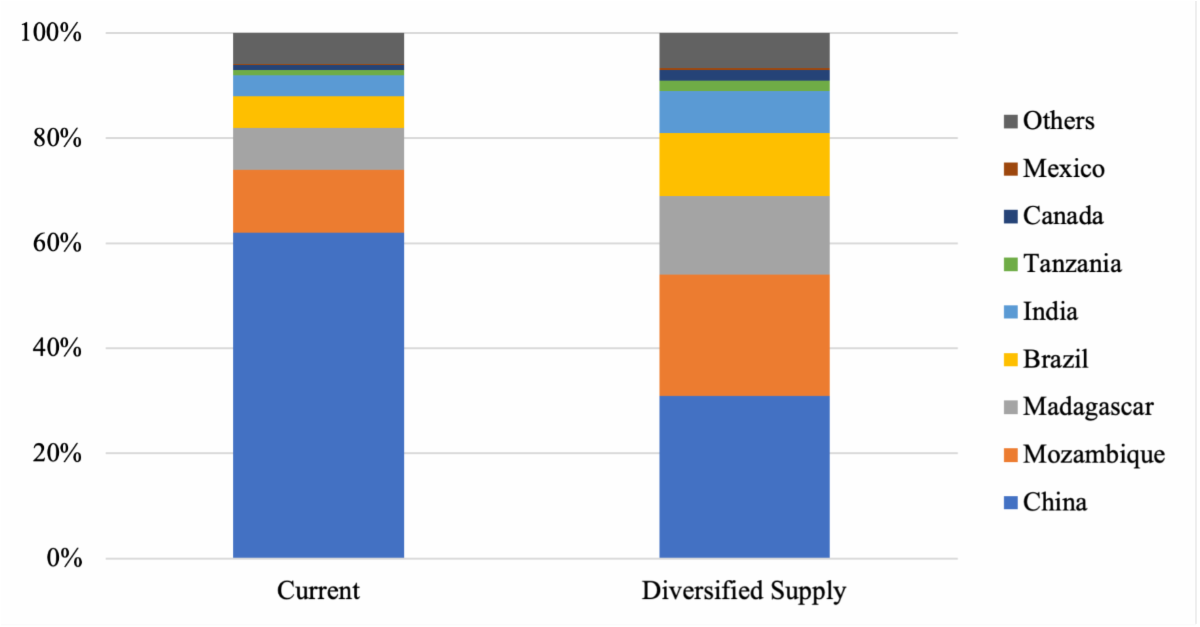
Figure 2. Potential for natural graphite global supply diversification from 2022 to 2035.
- India can be a major price-competitive global supplier of natural graphite. While India is ranked ninth in graphite reserves, it is among the top five global suppliers. Some countries with large reserves, like Brazil and Turkey, have not scaled production, and Ukraine and Russia have constrained outputs. Compared to other major natural graphite producers, India’s exports are priced competitively at around $650-700/tonne compared to the global average of $1,400/tonne.
- The Global South can leverage market share by complying with mining regulations. Many graphite-producing countries have a history of economically, socially, and environmentally exploitative resource extraction. The MSP has established Principles for Responsible Critical Mineral Supply Chains to ensure that projects meet environmental, social, and governance standards. Thus, MSP countries can be expected to favor exports that comply with these standards (Figure 3).
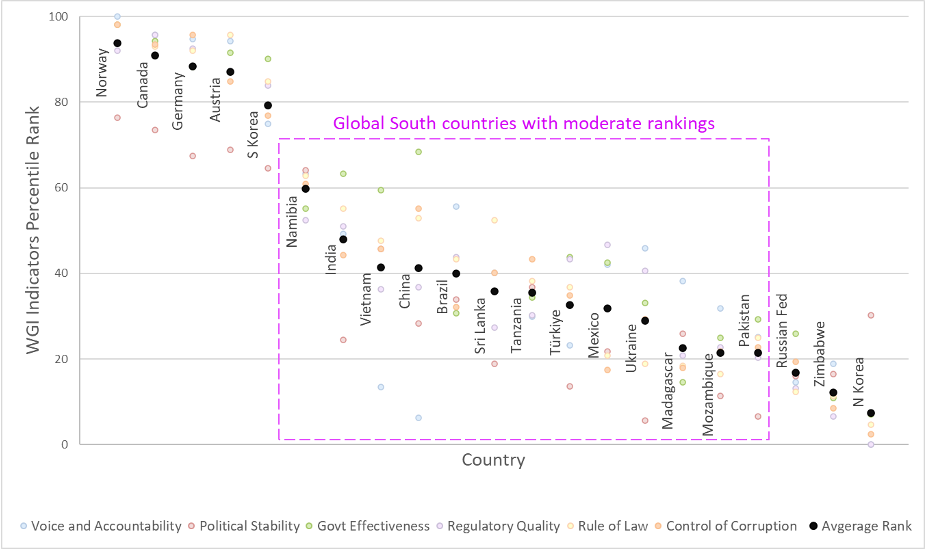
Figure 3. An assessment of Worldwide Governance Indicators in 21 graphite-endowed countries suggests that some Global South countries, including India, have emerged with relatively high rankings.
In summary, there is a growing need to develop a cohesive strategy on international trade of critical minerals and to de-risk the supply chain through diversification. There is also a rare opportunity to cultivate emerging market dynamics in a way that improves conditions in graphite-endowed countries in the Global South. Growing demand, new regulations, trade limitations and quotas, geopolitical interests, and other factors are changing the market, creating potential partnerships for graphite-endowed countries. However, to reap benefits from these changes, a commitment to improved regulatory compliance in mining from mine-owners and oversight agencies is essential.
Thank you for your interest in the UC Davis Institute of Transportation Studies. Subscribe today to keep up with the latest ITS news and happenings.