Note: this article was updated on Oct 1 after the Governor signed/vetoed all bills.
One notable addition to this article: SB961 was vetoed by the Governor, and would require all vehicles to have a speeding warning system, alerting drivers if they speed over 10 mph over limits. The senate is moving this bill back for a second reconsideration vote. If they get a ⅔ vote in not only the Senate, but both houses, this bill would have a life beyond the Governor’s decision. The Governor’s veto message applauds the intent of this bill, but suggests this type of action is outside of the purview of the state, and vehicle requirements should be made at the federal level.
—
The state of California is having a lean year, with severe budget cuts resulting in fewer notable sustainable transportation bills than in previous years. Despite this unfortunate budget cycle, a number of transportation and climate policies have moved through the legislature, with some already signed by the governor, and less than a dozen nailbiter bills on the governor’s desk awaiting his approval or veto this week before the governor’s September 30 deadline.
State budget takeaways: Roads and transit funded, bikes and clean air funds cut
While the state’s budget did have a significant deficit, which necessitated billions of dollars in cuts, many of the state’s core transportation expenditures were secured. Many of these expenditures are tied to revenues from specific taxes and fees—vehicle registration fees or gas taxes, for example—rather than to the fluctuating General Fund revenue which can swing with the state’s more unpredictable economic indicators like personal income taxes, sales taxes and corporate gains. The connection to a more stable funding source makes core spending, such as road maintenance, and core public transit funding relatively secure this year. However, ensuring the stability of these transportation revenues long-term will require a transition from petroleum-economy sources, like gas taxes, towards more stable carbon neutral strategies like mileage based fees.
Though this is not the year the legislature makes this transition, the state’s budget will include more electric vehicle (EV) incentives for low-income households. The budget does not include more spending on bikeways and pedestrian access. Bike-ped lost out because these investments are connected to a more vulnerable funding source, the Active Transportation Fund, which has historically been underfunded during lean years; this year’s Fund was $400 million less than last year. This comes at a time when the California Transportation Commision reported large social benefits from the Active Transportation Program based on a benefit calculator tool developed by Dillon Fitch-Polse and Matt Favetti. These cuts may inhibit California’s progress on climate goals. Broader climate efforts are also more vulnerable to budget cuts, and the Air Pollution Fund also saw a $300 million cut, which may further undermine efforts to reduce greenhouse gas emissions.
Electric vehicles (EVs): Hot topic of 2024 is EV charging reliability and deployment
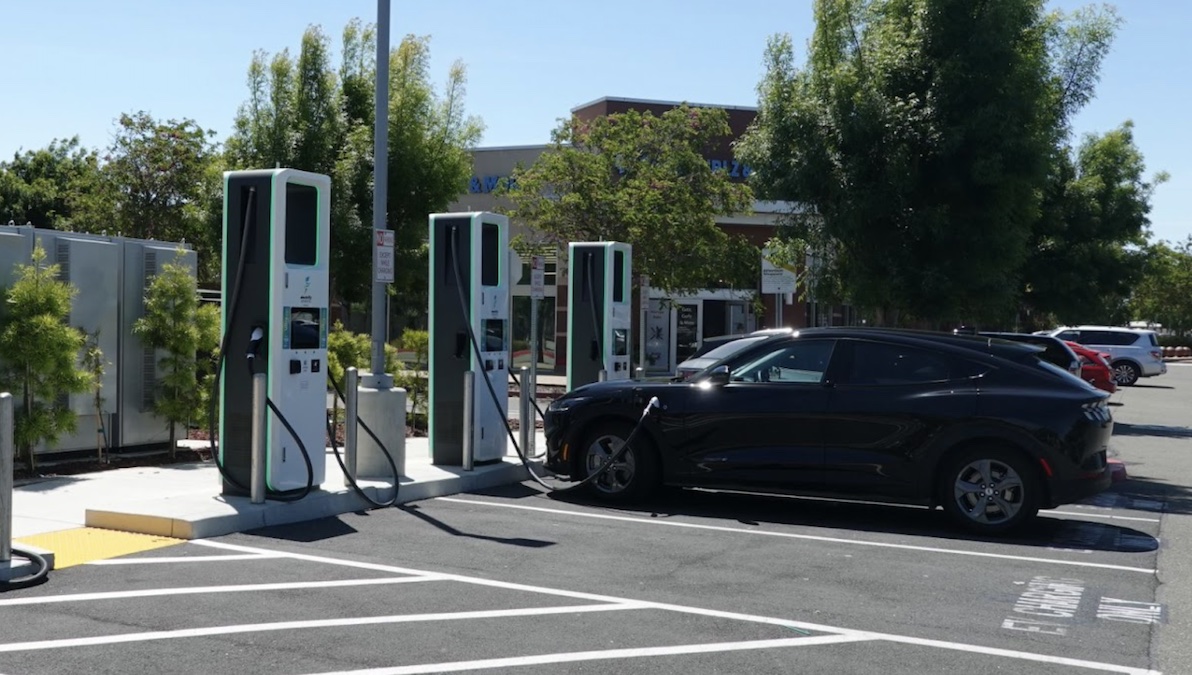
There will be other winners and losers this session. Charging stations did not get a funding boost this year as AB 2815 failed to make it out of the legislature. The bill would have advanced the state’s plan to expand access to reliable chargers by establishing a Clean Transportation Program to facilitate repair or replacement of non-operational electric vehicle (EV) charging stations. A recent report led by Tisura D. Gamage shows that among DC chargers tested, consumers could charge an average of 77%–83% of the time, with some networks online only 13% of the time. Researchers point to improving reliability of EV chargers as a necessary step to encourage EV driver confidence, which underscores the importance of several EV bills that did advance to the governor’s desk.
For example, AB 2453 was already signed by the governor, and will exempt certain electric vehicle chargers from certain re-testing requirements after receiving maintenance. AB 2037 (update: signed) will grant counties more control over testing EV chargers and more leeway to issue fines for broken chargers. Charger standardization has been a state priority, and the legislature also passed AB 2697 (update: signed), which will create a caveat for small chargers, requiring that only major EV network providers have to meet network roaming standards adopted by the California Energy Commission (CEC). This slate of EV charger bills charging forward in the state’s legislature largely aligns with findings from UC Davis researchers. UC Davis researchers continue to explore these topics and are currently testing the network reliability and user experience of the public EV Charging ecosystem.
Getting the dirtiest cars off the road: No updates this year
The governor vetoed an effort to retool the Clean Cars 4 All Program, which gives incentives to Californians to replace old and polluting vehicles with cleaner transportation options. AB 2401 would have seen some programmatic reforms aimed at improving equity and effectiveness of the program. Research from UC Davis, led by Debapriya Chakraborty suggests that programs like Clean Cars 4 All can encourage EV adoption. While this veto does not get rid of the Clean Cars 4 All program, the Greenlining Institute, one of the bill’s sponsors, pointed to the need for reforms to effectively remove the dirtiest cars from the road and ensure that the state prioritizes “supporting communities of color and low-income communities to transition to cleaner transportation.” This topic may be revisited more broadly in coming years, and UC Davis researchers are exploring the role of other state incentives programs, specifically the role of auto dealerships in the implementation of these programs.
Hydrogen
SB 1420 (update: signed) is intended to support hydrogen’s growth by making certain types of renewable hydrogen production eligible for exemptions to the California Environmental Quality Act (CEQA) that were previously reserved for renewable electricity projects. A recent UC Berkeley and UC Davis research project, led by Berkeley Professor Tim Lipman, recommends that regulators “include biomass/biogas pathways in legislative and policy definitions of ‘green’ or low-carbon intensity hydrogen where they can be clearly shown to have low or negative [carbon intensity].” This new law will heed this research recommendation by fast tracking hydrogen facilities that do not use fossil fuel feedstock. Research shows that hydrogen will likely be a critical tool in the effort to decarbonize our electricity and industrial sectors, and California recently received $1.2 billion from the U.S. Department of Energy to build a hydrogen hub in California. SB 1420 will help support this effort by speeding the development of low-carbon hydrogen production, including gasification of biomass or electrolysis using renewable electricity.
Public transit: Regional bills aim to move forward Sacramento, LA, and Bay Area transit
Several bills address regional public transit issues. AB 1924 and AB 2634, both of which have already been signed into law, allow Sacramento Regional Transit District to expand its service area and offer senior fare discounts. Research from UC Davis shows that income-based fare discounts can be beneficial in some settings, but other factors like improved transit governance are also key in improving service outcomes for riders. This research on transportation governance is relevant to another regional transit bill. SB 1098 (update: signed) will aim to improve management of the Los Angeles–San Luis Obispo–San Diego (LOSSAN) Rail Corridor through required reporting and a new stakeholder working group.
Planning bills to advance pedestrian safety, transit and complete streets
SB 960 (update: signed), referred to as the “Complete Streets Bill,” aims to improve roadway design and safety for pedestrians, bicyclists, and transit users through Caltrans requirements. According to Streetsblog the bill was amended in committee to provide Caltrans more flexibility in its implementation while still advancing the goals of improving multimodality on California’s roads. The need for complete streets is well-supported in the literature. In addition, researchers at Georgia Tech and UC Davis, led by April Gadsby, recently developed a complete streets roadmap, to inform not only development but maintenance of a complete street, suggesting strategies for asset management that ensure longer term multimodal network connectivity. Turning to bigger picture planning efforts, AB 2086 (update: signed) will require the California Transportation Plan (CTP) to be “fiscally constrained.” This would make the Plan more useful and would include financial analysis that clarifies the cost of the Plan’s implementation. The new law will also require Caltrans to report, through an online dashboard, how annual project investments advance the Plan. This move aligns with research from UC Berkeley and UC Davis, led by Betty Deakin, that showed that the CTP was limited in affecting change because it did not mention projects, only policies and strategies, and this omission limits how regions can interpret the state’s guidance and choose between projects. Fiscally constraining the CTP may move the state in the direction of making the CTP more practical and implementable.
Automated vehicles: Amid more regulatory activity, lawmakers also call for more data and more traffic tickets
State regulators have recently issued several draft rules on the topics of automated vehicles (AV) operation and data sharing and are currently taking open public comments on these rules (Proposed decision of the California Public Utilities Commission [CPUC], Proposed rules of the Department of Motor Vehicles [DMV]). But California elected lawmakers also want to get in on this AV policymaking action and are proposing a few slightly different sets of requirements, with some overlap. For example, DMV is proposing that AVs include an external microphone and speakers and a visual indicator to show law enforcement whether the car is in autonomy mode or not. AB 1777 (update: signed) passed with a more than a ⅔ majority in the senate and a strong showing in the assembly as well, so this may have been a veto-proof bill. The new law will require a phone line in AVs equipped with “two-way voice communication,” to ensure emergency responders can interact with staff members representing the vehicle fleet. AB 1777 also calls for companies to be able to respond to a “geofencing message” that might restrict their movement into or out of an emergency zone, or otherwise restricted area. UC Davis research led by Mollie D’Agostino reports that cities are looking for strategies to improve interactions between first responders and fully driverless vehicle operators, so both the proposed regulations and the new law may speak to these goals.
Both regulators and elected officials are also weighing in on how to better capture automated vehicle data. A recent UC Davis white paper underscores the importance of data collection to advance sufficient oversight of autonomous vehicle operators. The proposed decision from the CPUC proposes to expand quarterly reporting requirements on crashes and incidents, as well as expanding reporting on what they refer to as “vehicle immobilizations” or stopped vehicles. The legislature also passed AB 3061 (update: vetoed). This bill would have addressed many similar topics covered in both the CPUC and DMV proposed rules. For example AB 3061 would have called for a faster incident reporting timeline, which is somewhat similar to what DMV is proposing for accident reporting, but also requiring companies to more quickly report on other incidents of traffic or safety violations. Since AB 1777 is now law, but AB 3061 is not, regulators will have to defer to the legislature and update regulatory requirements to align with AB 1777.
Autonomous Trucks: Bill could stop recent regulatory go-ahead
The aforementioned DMV proposed automated vehicle rule also includes a plan to lift the historic ban on the operation of driverless heavy-duty freight vehicles, weighing more than 10,000 lbs, and to develop a testing-to-deployment phasing strategy. Yet AB 2286 (update:vetoed) would have blocked elements of this regulatory action and required safety drivers to be present in all heavy-duty automated vehicles operating in the state all the time. This would have blocked a pathway for full deployment of automated trucks in California. At several DMV workshops on the topic of automated trucking, many drivers and union organizers conveyed that they are fearful of workforce impacts of automated trucking. However, research led by UC Davis professor Miguel Jaller evaluated the impacts of automation on freight jobs, finding that due to long timelines for adoption and other considerations, automation is not likely to result in immediate or severe workforce effects. Jaller found that policy interventions may still be necessary to help ensure workers are not impacted. Other research points to where there may be workforce growth in the AV sector. UC Davis and UCLA researchers are investigating policy and safety considerations for two key human roles in an automated vehicle fleet, the safety driver and remote operator. The new DMV proposed rule does expand on the definitions of the remote roles, and suggests more explicit training and licensure requirements.
Bikes
A Class III bikeway is where bike riders and car drivers share space, often marked by sharrows showing the preferred bicyclist lane position. SB 1216 (update: signed) will prohibit some agencies from installing a Class III bikeway on a road where the speed limit is greater than 30 miles per hour and prevent the use of Active Transportation Program funds for Class III bikeways. Dillon Fitch-Polse led an ITS research report that supports the idea that high speed roads should not have unprotected bike traffic. Another bike lane bill sailed through the legislature and has already been signed by the governor, SB 689 will ease the requirements for coastal cities to convert motorized vehicle lanes into dedicated bicycle lanes. Meanwhile a similar bill dubbed the Quicker and Better Bikeways Bill, AB 2290 failed to make it out of committee and would have authorized a “quick build” pilot program within Caltrans to more efficiently implement capital improvement projects, and would also prohibit Class III bike lanes from seeking Active Transportation Program funding.
E-bikes: Bill bonanza
UC Davis research led by Dillon Fitch-Polse shows that electric bikes (e-bikes) are a good strategy for reducing car dependence. And as e-bikes proliferate, so have California bills addressing their safety and local usage restrictions. At least four e-bike bills made it to the governor’s desk (and several others died in the legislature). AB 1774, dubbed the E-Bike Modification Bill by the CalBike Coalition, was passed and signed by the governor. The law will prohibit someone from tampering with a product to make it exceed the defined speed capability of an e-bike. SB 1271 (update: signed) the E-Bike Battery Safety Bill, will now prohibit a person from selling, leasing, or renting an e-bike unless the battery has been tested by an accredited laboratory for safety compliance. Finally, several locally-focused bills seek to limit ages for e-bike usage. AB 1778 (update: signed) will authorize Marin County to adopt an ordinance that would prohibit a person under 16 from operating a class 2 electric bicycle or require a person operating a class 2 electric bicycle to wear a bicycle helmet. (Class 2 e-bikes have throttles to power the bike even when the rider is not pedaling, and they are limited to 20 miles per hour.) AB 2234 (update: signed) is now law and will enable San Diego to limit riders to 12 and older.
—
Mollie Cohen D’Agostino is Executive Director of the Mobility Science, Automation and Inclusion Center at the ITS-Davis
Simone Hudson is a law student at the UC Davis School of Law
Sara Schremmer is Policy Director at the National Center for Sustainable Transportation at ITS-Davis
Juan Carlos Garcia Sanchez is EV Policy and Equity Manager at the EV Research Center at ITS-Davis
Colin Murphy is co-Director of the Low Carbon Fuel Policy Research Initiative at ITS-Davis


 On the path to global transportation sustainability, electric vehicles (EVs) are making inroads, but larger cars with bigger carbon footprints are hampering climate progress. The right policies can correct our course.
 Driving between the Bay Area and Sacramento has long been a challenge. For the past several months, it has been a construction nightmare. Heading east from Davis, drivers face seventeen continuous miles of construction zones, first for the