Biofuels are an important tool to help decarbonize our transportation system, and their role will likely grow in coming years. New tax credits authorized under the Inflation Reduction Act are being finalized; these would offer significant incentives for the biofuel alternatives to conventional jet fuel, so-called “Sustainable Aviation Fuels” or SAF. But it’s not always clear how sustainable these fuels truly are, or whether they offer a significant GHG advantage over petroleum. The proposed SAF tax credits limit eligibility to fuels that offer at least a 50% reduction in life cycle GHGs compared to petroleum and give additional incentives to those that exceed that threshold.
Advanced fuel technologies – such as those that use inedible wastes, hydrogen, or fuels synthesized using renewable electricity – may eventually deliver very low carbon fuels, but they have yet to emerge at commercial scale. This means that current biofuel technologies that use food crops like corn or soybean oil, are likely to receive most of these tax credits for the next several years, at least. Assessing the GHG benefits of current biofuels requires a descent into the wonky world of lifecycle analysis—measuring the total emissions through farming, processing, and consumption. Much of this is fairly straightforward, by the standards of researchers and expert analysts, until one gets to the use and displacement of land.
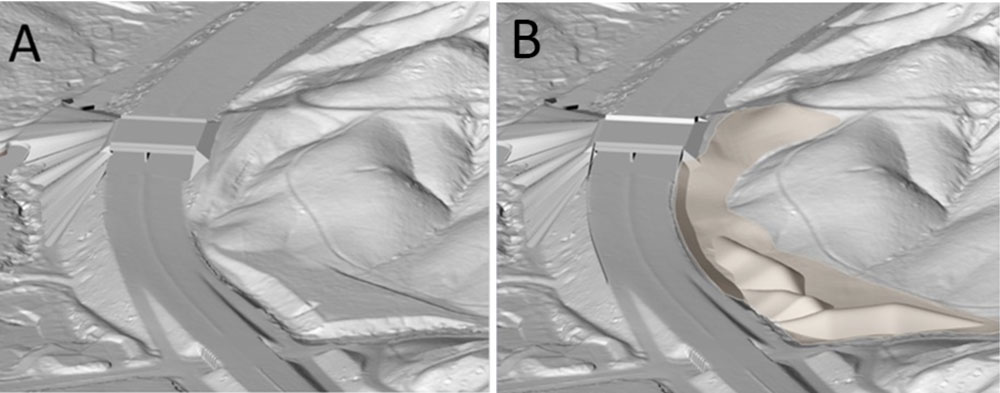
While crop-based biofuels can reduce GHG emissions when used in place of petroleum fuels, they compete against food crops for arable land. When biofuel production increases demand for agricultural commodities like corn or vegetable oil, growers often meet this demand by expanding their planted area. Clearing land for cultivation releases much of the carbon stored in plants and soil into carbon dioxide, a greenhouse gas and the primary driver of climate change. This process of biofuel demand causing land conversion is known as Indirect Land Use Change (ILUC), and it has been a point of deep contention around biofuels over the past 20 years.
Experience has taught us that we ignore ILUC at our peril. European attempts to increase the use of biodiesel in the 2000’s overlooked the issue of emissions from land clearing. This led to widespread slashing and burning of tropical rainforest to expand palm oil plantations, much of it on sensitive high-carbon peat soil. Over 6 million hectares of tropical rainforest was lost in Indonesia and Malaysia between 2000 and 2012, demand for biofuels accounted for as much as half of this. Emissions from this conversion dramatically outweighed the benefits from additional biofuels.
Over the next few years, the key question for policy makers is: should we incentivize the consumption of more crop-based fuels, such as those made from corn or soybean oil and, if so, how much? Understanding the impacts of ILUC and getting the question right is essential to ensuring our climate policies actually reduce emissions.
All models are wrong, some models are useful
Estimates of ILUC arising from crop-based biofuel production are highly uncertain. The lowest estimates rate crop-based biofuels as up to 50% less carbon intensive than petroleum gasoline or diesel, while the highest estimates suggest that they’re several times more carbon intensive than petroleum.
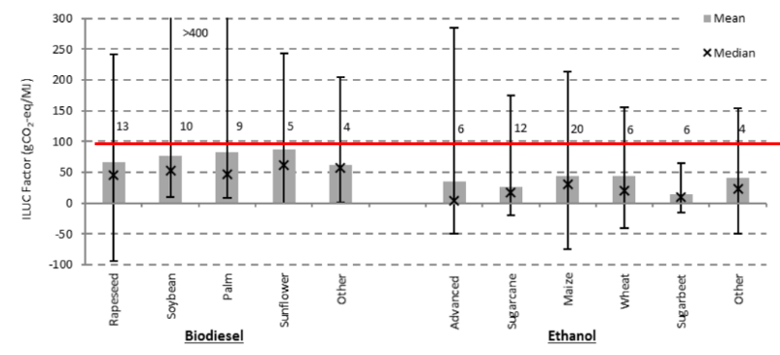
Estimates of ILUC factors found in literature for a variety of fuels. Height of the gray bar represents the mean, black “x” represents the median, with uncertainty bars covering the full range of ILUC factors, and the numbers showing the number of studies contributing data points to each category. Red line shows the typical carbon intensity of petroleum. Source: Woltjer et al. (2017)
This uncertainty is due to three main factors:
- Complexity. Accurately modeling ILUC means accurately modeling the entire global agricultural commodity system, and the decisions of millions of individuals that make it up. Reducing this complex, dynamic system down to a single, fixed number is an impossible task, but nonetheless necessary to create a stable regulatory structure.
- Subjectivity. There’s no perfectly objective method for analyzing emissions from complex systems, like biofuel production or ILUC emissions. Modelers must set system boundaries and allocate impacts between products. Soybeans, for example, yield oil and high-protein meal, used as food for livestock or people. Assigning energy and pollution burdens to each of these is a subjective process. Two analyses of the same product can use equally valid assumptions and result in widely differing estimates of GHG impact.
- Calibration and validation. Developing ILUC models requires calibrating against real-world data about how growers make decisions about what to grow and where. These data are often incomplete, non-public, hard to interpret, or unavailable. More importantly, historical data don’t include future climate change impacts. We know that rising temperatures and changing weather patterns will make some highly productive growing areas too hot or dry to maintain yields, and other areas will become fertile. These factors will change how and where growers choose to expand cultivation – which means today’s ILUC model predictions will necessarily be calibrated with unrepresentative data.
Due to these challenges, estimates produced by any ILUC model will be rough representations of a dynamic system, based on subjective assumptions, and calibrated against data that does not reflect the world we’re trying to make policy for. In plain language: they’re going to be wrong. The thing is, there are a lot of different ways to be wrong, some of them worse than others. The question for policy makers in this case is: What’s the right way to be wrong
How to Make Decisions When Models Are Wrong
A perfect fuel policy would provide enough support to crop-based biofuels to maximize near-term decarbonization, but not so much that demand for agricultural products soars and exacerbates ILUC-driven emissions.
In a perfect world, we would use a perfect ILUC assessment to perfectly align incentives with real-world impacts, but that’s not possible in this case, so it helps to think through what happens when we’re wrong. Overestimating ILUC’s impact means biofuels will have higher carbon intensity scores on regulatory assessments, and so fewer of them will be eligible for credits and we would expect to see less of them enter the market; overestimating ILUC would therefore lead to consuming less than the theoretically optimal amount of crop-based biofuels. Underestimating ILUC’s impact means biofuels will have lower carbon intensity scores, more would be eligible for policy support and we would expect to over-consume them compared to a theoretical ideal.
If we get biofuel policy wrong in a way that causes us to under-consume biofuels, then we miss opportunities to reduce GHG emissions. Every billion gallons of renewable diesel made from soybean oil could offer the opportunity to reduce GHG emissions by about three million tonnes of CO2 equivalent.[1] This is not a trivial or meaningless loss. We know we must reduce emissions very quickly in coming years in order to achieve carbon neutrality by mid-century, and soybean oil based biofuels have demonstrated commercial success already.
There are significant GHG impacts of over-consuming biofuels, as well. Each billion gallons of soybean oil based renewable diesel requires about 15 million acres of land to grow – roughly the size of West Virginia. If this land were grassland in the U.S. Midwest before being converted to cultivation, the GHG emissions from land use change alone would be over two million tonnes of carbon equivalent, and much more if it were forested or land with high-carbon soil that was converted.
These direct GHG impacts are only part of the story, however. As we dig deeper into the risks associated with over- and under-estimation, critical differences arise.
- Timing. Carbon in land accumulates slowly but is lost quickly. Plants remove CO2 from the air over time, storing it as solid carbon and accumulating as organic matter in the soil. Converting natural land to cultivation releases that carbon in a matter of weeks to a few years. Once it’s lost, it often takes decades to recover, if it recovers at all.
- Diminishing returns. Higher-yielding land is likely to be converted from carbon-storing natural cover to crops first. Each additional million acres of cultivated land is likely to yield a bit less than those that were converted before it. As total demand increases, the additional land needed for every extra unit of production is expected to increase.
- Political momentum. It is easier for politicians and regulators to give support to businesses than to withdraw it. Removing support can also reduce the effectiveness of future climate policy; if governments signal, via policy incentives, that investors should back biofuel projects and then quickly withdraw the incentives, those same investors would be justifiably skeptical about trusting other climate policy incentives. Starting off with lower levels of support and adding mores in the future, on the other hand, avoids sending mixed signals to the market.
These issues show that the risks entailed from under- or overshooting optimal biofuel production volume are not equal. Insufficient support for crop-based biofuels could cost us the opportunity to reduce emissions, but excessive support for them could be significantly worse. Land conversion causes a loss of stored carbon that cannot be reversed on a time scale that allows us to meet mid-century GHG targets. Once over-production of biofuels occurs, any attempt to correct it could lead to stranded assets and break financial markets’ trust that policy signals are a reliable guide when making investment decisions.
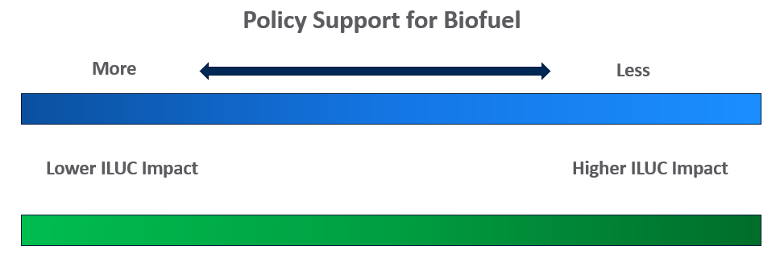
We know that ILUC analysis is difficult to get right, and we cannot count on developing a model to predict the optimum level of crop-based biofuel consumption any time soon. If we can’t be sure we’re right, we should make a decision that recognizes the profoundly asymmetric risks around biofuel consumption. The risks entailed with underestimating ILUC impacts are far worse than the risks of overestimating them, so we should err on the side of overestimation.
Developing a Risk-Aware Approach to Biofuels
In practical terms, this means the arguments over which ILUC model is best are not terribly helpful since every model is going to be inaccurate. Instead, we should look at the full range of ILUC estimates we get from the many approaches of ILUC estimation that have been put forward by researchers. We’re relatively confident that the correct answer lies somewhere within this very wide range. The risk-aware approach to biofuel policy is to select a number high enough that it’s very unlikely we underestimate the real value.
“High enough to not be an underestimate” is still not precise enough to be helpful. Other landmarks can help us get closer to a risk-aware ILUC impact estimate. We know, based on extensive scientific research, that fuels from wastes and residues generally have lower ILUC impact, and that fuels from palm oil are very likely to be worse than the petroleum they try to displace. An effective ILUC assessment should align with the ample scientific evidence on these topics.
Support for additional research and modeling can help us both narrow the range of uncertainty around this issue, as well as identify what ILUC impact value within that range should be chosen to yield the best possible result. Expert-driven consultative processes, like the National Academies committee on biofuel life cycle assessment or CORSIA workgroups developing sustainability and GHG assessment methods can serve a vital role here, not only as clearinghouses for the latest research in this space but also to allow stakeholders to engage with the process. These groups can find mutually acceptable approaches to some, though certainly not all, of the subjective decisions that are an unavoidable part of LCA.
Just as there is no perfect ILUC model, there is no simple solution to alternative fuels. We know, however, that it’s going to be virtually impossible to meet critical decarbonization targets without lower-carbon liquid fuels. Avoiding the worst impacts of climate change will require risk-aware policies that succeed without perfect modeling. In the case of crop-based biofuels, it’s quite clear that the worst risks arise when we underestimate ILUC impacts. We know that our attempts to quantify ILUC risk are likely to be wrong, but we also know that there’s a less-damaging way to be wrong in this case. Policy should reflect this reality.
Colin Murphy is the Deputy Director of the UC Davis Policy Institute for Energy, Environment, and the Economy, and the co-Director of the Low Carbon Fuel Policy Research Initiative there. Any statements or inaccuracies herein are solely the responsibility of the author and should not be taken as representing UC Davis or the Policy Institute.
The material in this blog was originally presented as part of the EPA National Center on Environmental Economics seminar series, a recorded version is available via the UC Davis Low Carbon Fuel Policy Research Initiative website. The author would like to gratefully acknowledge the assistance of Amber Manfree, Dan Sperling, and John Schmitz in helping develop and refine this material.
[1] Assuming 65 gCO2e/MJ carbon intensity (derived from approximate average CI of such fuels under California’s LCFS), and that each gallon of renewable diesel displaces 1 gallon of petroleum diesel with 91 gCO2e/MJ carbon intensity (approximate average of U.S. diesel supply).