Archives

New Mobility for Sustainable Suburban and Rural Travel

Sustainable Suburban and Rural Travel

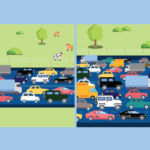
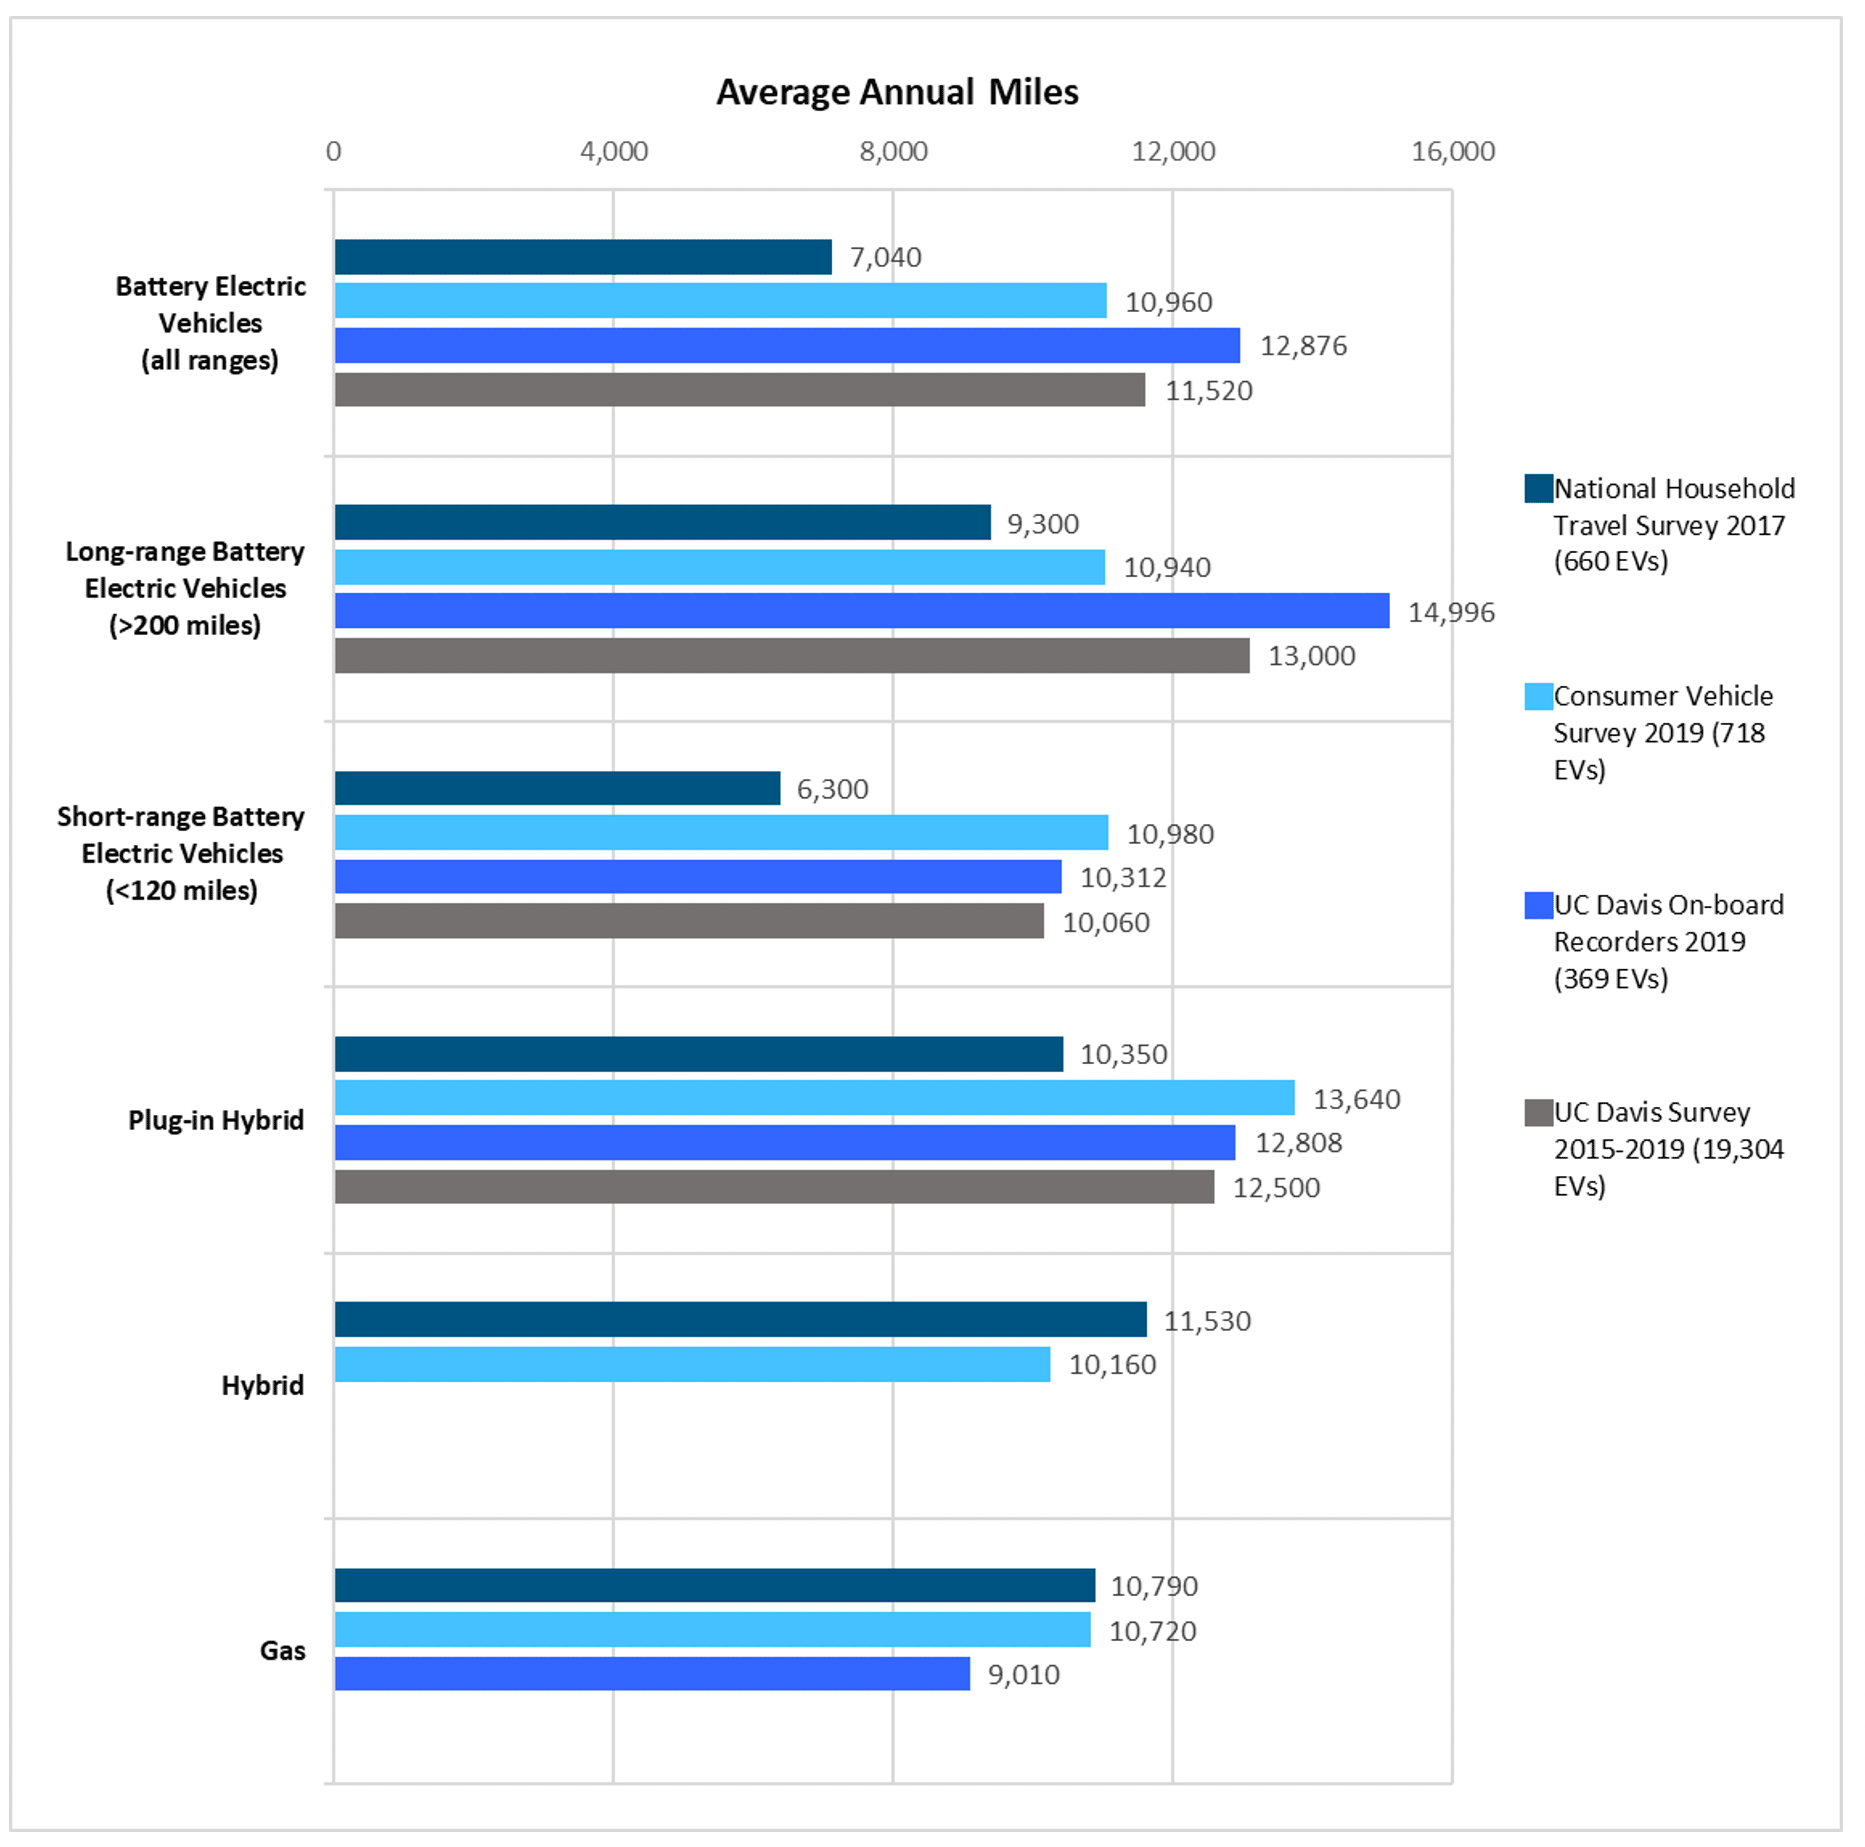
There are many reasons to reduce our reliance on cars—they are polluting, inefficient, dangerous, and expensive to own. In dense urban areas, travel modes such as walking, bicycling, and public transit can be reasonable alternatives for many peoples’ transportation needs.

But what about suburban and rural areas with lower population densities and longer distances between destinations? Land use patterns in these regions make it challenging to get around without a private vehicle. Can emerging mobility options reduce car dependence in these environments?

Based on our research so far, the answer appears to be yes. Our research teams are at the forefront of evaluating how new mobility services such as microtransit (on-demand, small shuttles providing shared rides), carsharing, and ridesharing are being used and the extent to which they are substituting for private car travel in California’s suburban and rural contexts.

Microtransit in Suburban Sacramento

Suburban communities around Sacramento are not well served by fixed-route transit. In 2018, Sacramento Regional Transit launched a microtransit service called SmaRT Ride to fill this gap. SmaRT Ride is available in eight outlying areas and the downtown core that allows travelers to request a “door-to-door” or “corner-to-corner” ride via a smartphone app. Rides cost the same as fixed-route transit.

Dr. Xing’s team studied early adopters of SmaRT Ride, conducting surveys and focus groups of both users and non-users of the service. When asked about transportation choices, more than 40% of riders said that, without SmaRT Ride, they would have made their last microtransit trip by car instead. This suggests that microtransit has real potential to reduce dependence on driving.

The study also found that more than half of SmaRT Ride users had an annual household income of less than $50,000, and that users of the service are more likely than non-users to have physical limitations. Finally, people who do not like fixed-route transit or have a neutral attitude towards it are more likely to use SmaRT Ride than are those who like fixed-route transit. This suggests that microtransit is more of a complement to, rather than a replacement for, fixed-route transit.

Innovative Mobility in the San Joaquin Valley

Dr. Rodier has been engaged with regional partners since 2014 to plan, launch, and evaluate three mobility pilots in the rural San Joaquin Valley. The region is characterized by high levels of poverty and air pollution and long distances between destinations, presenting particular challenges for providing clean and affordable transportation.

In 2019, three services were launched in the region: Míocar, an electric carsharing program with vehicle hubs at affordable housing complexes in Tulare and Kern counties; VOGO, a volunteer ridesharing service; and Vamos, a Mobility-as-a-Service app that facilitates trip planning and ticket purchasing across the valley’s many transit services.

So far, the research shows that each of these services is helping people move around the region in new ways. More than 60% of Míocar trips would not have occurred without access to the service, and three-quarters of the miles traveled on these “new” trips were made by travelers from households below the median income level in their county. People who would have used another mode to make their trip in the absence of Míocar would have traveled almost exclusively by gasoline-powered cars. So the service reduces greenhouse gas emissions for those trips.

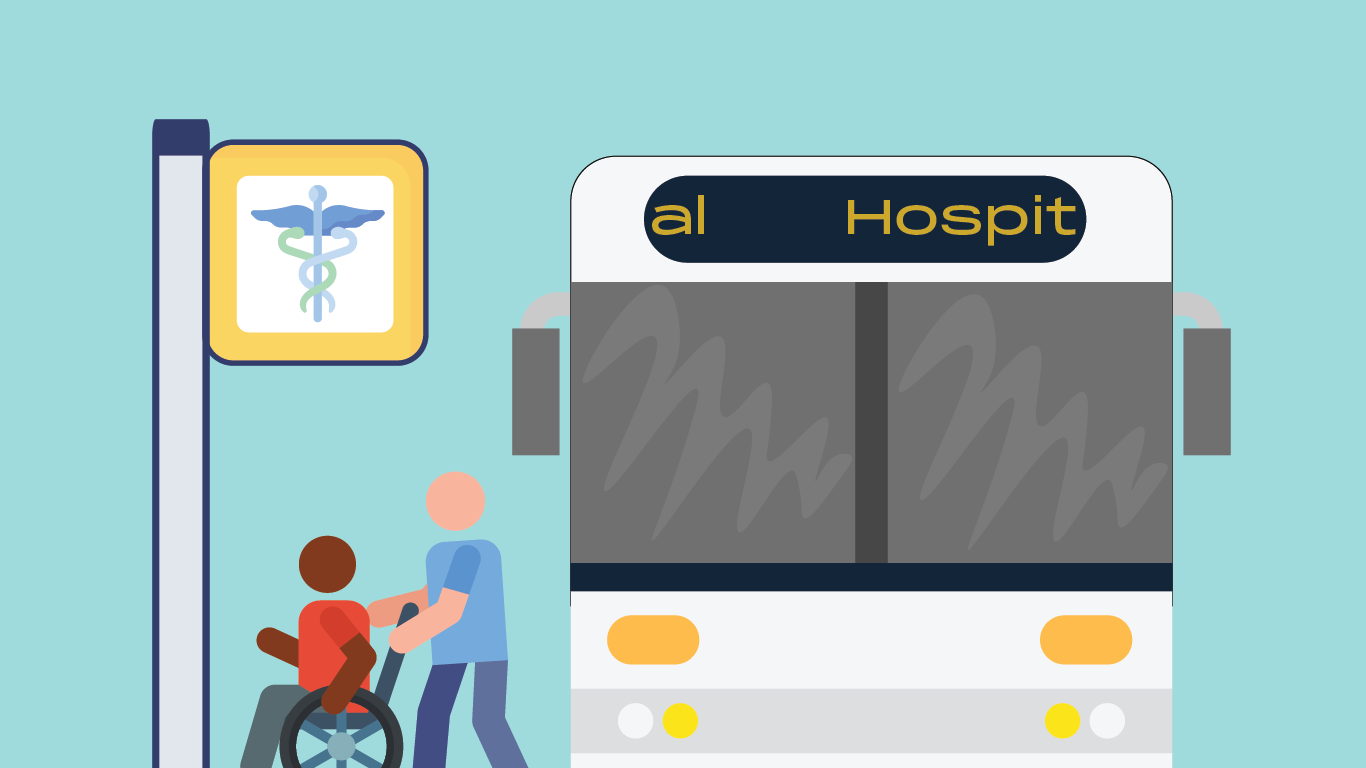
Similarly, most of those using the VOGO ridesharing service would not have otherwise been able to make their trips. Most VOGO riders do not have access to a personal vehicle and are uncomfortable driving vehicles due to medical issues or other concerns, leaving them with few options for trips that cannot be made via existing transit services. Finally, early study results suggest that Vamos is a valuable transit fare payment tool and contributes to an improved transportation experience for its active users. More study is needed to assess the effects of Vamos on transit use and mobility as this app expands its service area and user base.

Key Takeaways

Small mobility programs like these are proliferating as communities seek affordable, sustainable alternatives to private vehicle ownership. Our research is showing early indications that these programs can be successful in meeting rural and suburban transportation needs, particularly for low-income travelers. However, these services need continued support. Private ridehailing and carsharing companies typically offer their services in higher-income urban areas that already have plentiful transportation options. To increase clean transportation access in underserved communities, new business models may be needed. These may include direct service provided by a transit agency, such as SmaRT Ride, or a non-profit service operated with public subsidies, such as Míocar. Further coordination among transportation providers and community-based organizations will be essential in identifying and developing transportation solutions to meet the needs of individual communities. Rigorous evaluations of these programs as they develop can assess their contributions to policy goals related to transportation equity and climate change, and inform longer-term investments.

Further reading:

NCST SmaRT Ride report and policy brief: https://ncst.ucdavis.edu/project/exploring-consumer-market-and-environmental-impacts-microtransit-services

UC ITS Míocar report and policy brief: https://www.ucits.org/research-project/2019-44/

NCST San Joaquin mobility report and policy brief: https://ncst.ucdavis.edu/project/before-and-after-evaluation-shared-mobility-projects-san-joaquin-valley


Yan Xing is a postdoctoral researcher at ITS-Davis.

Caroline Rodier is a researcher at ITS-Davis and the associate director of the Urban Land Use and Transportation Center at UC Davis.

Brian Harold is the policy evaluation specialist at the UC Davis Policy Institute for Energy, Environment, and the Economy.

Mike Sintetos is the policy director at the National Center for Sustainable Transportation (NCST) and UC ITS Statewide Transportation Research Program.

Ecology 101: Protecting Wildlife from Transportation

Wallis Annenburg Wildlife Crossing | Photo: Courtesy of the National Wildlife Federation

(Photo: Courtesy of the National Wildlife Federation)


The Wallis Annenberg Wildlife Crossing in Agoura Hills, California, which will soon be under construction, is unprecedented in its size, cost, and primary purpose. Estimated to cost $90 million, it is the first major wildlife over-crossing primarily aimed at bringing genetic diversity to isolated animal populations rather than preventing roadkills—though it will do that, too.

The crossing, also known as the Liberty Canyon Wildlife Crossing, will be an overpass covered with vegetation, spanning ten very busy lanes of US Highway 101. It will allow mountain lions and other species to cross between the Simi Hills to the north and the Santa Monica Mountains to the south. Without this crossing, the mountain lion populations in the area would likely disappear in the next few decades because of inbreeding, vehicle strikes, and limited space to escape from wildfires.

Traffic Light and Noise

The planned crossing features design elements that will encourage mountain lions and other species that are sensitive to light and noise to actually use it. Barriers and berms will be built to reduce the amount of traffic-generated noise and light that reaches the areas that animals will use to approach the crossing. Three of our research projects at the Road Ecology Center on roadway light and noise helped influence this design. These projects were supported through state (SB1) and federal (USDOT) funds to the UC Davis Institute of Transportation Studies and the National Center for Sustainable Transportation, respectively. 

In the first of our related projects, we found that wildlife crossings are used by larger proportions of nearby, light- and noise-sensitive animal species if the crossings are comparatively dark and quiet. Our second study showed that the different behaviors among animal species in response to traffic noise and light determined how much they used wildlife crossings with varying traffic disturbance conditions. In the third study, we investigated ways of mitigating light and noise near the Wallis Annenberg crossing and a proposed over-crossing for I-15, near Temecula, California. First we found that light and noise from traffic could be detected more than 100 meters away from the highway in the animal approach zones of both crossings. We then used 3D-design software and traffic-noise modelling software to show that changing the configuration of barriers and berms near the crossings could reduce the traffic noise and light in the approach zones (Figure). Based on the results, we made recommendations to the designers to increase the chance that wildlife will approach the crossings.

Noise glare mitigation

Figure: Noise and glare mitigation in the approach zone to the crossing. (A) Typical approach to crossing structure without noise and light abatement. (B) Quiet and dark paths created by excavating and redistributing landscape materials (tan areas) and adding barriers along the highway.

The Need for Fencing and Crossings

Every year, more than 7,000 vehicle collisions with large, wild animals (e.g., deer, black bear) are reported in California, according to our California Roadkill Observation System (https://wildlifecrossing.net/California), and this is likely a significant undercount. For example, State Farm Insurance Co. estimates that there are upwards of 20,000 claims/year for deer-vehicle collisions in California. Not only can these crashes lead to loss of human life, property, and animal life, they can also affect the balance of ecosystems. 

One way to slow the decline of wildlife species is by lowering direct and indirect mortality from traffic. We know that we can reduce the number of vehicle collisions and alleviate genetic isolation with simple tools: 1) traffic calming and reduction, 2) fencing alone, and 3) fencing combined with wildlife crossing structures. Research done in California by the Road Ecology Center has shown where wildlife crossings and fencing are most needed and could provide greater economic benefits than their cost (https://wildlifecrossingcalculator.org). The state is already home to more than 100 wildlife crossings, used by a wide range of reptile, amphibian, and mammal species. But there is a grave need for at least ten times as many. 

Policy Environment

In the past few years, public support for wildlife crossings has grown significantly. Knowledge and awareness of crossings has spread from research scientists, to transportation planners and engineers, to the wider world. But policies and related budgets remain inadequate to the needs. Two Legislative efforts reflect this picture. 

First, the 2021 Federal Bipartisan Infrastructure Law initially authorized $350 million for new wildlife crossings. Ultimately, however, Congress appropriated $0 of the $350 million for crossings. Second, California Assembly Bill (AB) 2344 initially required the Department of Fish and Wildlife and Caltrans (the California Department of Transportation) to investigate areas that are essential to wildlife movement and habitat connectivity, to develop a plan to address these areas, and for Caltrans to implement 10 crossing structures per year. This last and strongest requirement was supported by hunting and environmental groups, but was recently removed from the bill. Although compromise of environmental legislation is an all-too-common occurrence in California, the future will tell whether this critical requirement will be negotiated back into the bill. 

In California, Road Ecology Center research shows that wildlife-vehicle collisions cost the state upwards of $250 million per year. While the state’s transportation budget is $20-25 billion per year, Caltrans has claimed that only two to three wildlife crossings are built per year in California, which, at most, would account for about 0.1% of the annual transportation budget. Yet, surveyed taxpayers consistently report that they would be willing to pay more taxes in order to protect wildlife. And state policy may finally be starting to reflect this outlook. SB 790, signed by Governor Newsom in October 2021, included $61 million for building wildlife crossings, $7 million of which was allocated for the Wallis Annenberg crossing. 

In sum, we know where to build wildlife crossings and fences; research is improving the effectiveness of these tools; and we can approximate their cost and benefits. We have a lot of information for decision support on how to address habitat fragmentation, wildlife deaths, vehicle accidents, and the cost to humans and nonhuman animals. While the policy and transportation planning response has grown significantly, we still need more from implementing transportation agencies to protect wildlife and from legislative bodies to require action and allocate more funding to make it possible.


Fraser Shilling is the director of the Road Ecology Center at the UC Davis Institute of Transportation Studies (ITS-Davis); Seth Karten is a senior writer at ITS-Davis.

How Providing Emissions Information Can Begin Greening Aviation

Illustration of flight schedule board with blank rows and positive or negative CO2 indicators at the end of each row

Those carefree, pre-pandemic days of hopping on a flight for a meeting or vacation without a second thought may seem like a distant memory to some of us right now. Still, air travel this fall has far exceeded that of 2020, even if it has yet to recover to pre-pandemic levels. Fairly soon, flying will almost certainly return to the upward trend that showed global air travel more than doubled from 2004-2019.

That’s a problem for the climate.

Flights accounted for about 2.5% of worldwide greenhouse gas emissions in 2019. While the federal government has announced an emissions reduction target of 20% by 2030 and a key airline industry group has recently proposed a net-zero plan, there is no firm consensus on a path to decarbonization for the aviation sector.

Can individual travelers play a role in reducing emissions?

Many climate hawks are cutting back or choosing not to fly at all. And it turns out that even when we do fly, our choices matter–different flight itineraries on the same route can vary quite a bit in the amount of greenhouse gases they generate, primarily due to the number of layovers (take-offs and landings produce a lot of emissions), the locations of the layovers, and the fuel efficiency of the aircraft. For example, a traveler heading from Sacramento, CA to Washington, DC might see a selection of flights that vary in emissions by as much as 30%.

That’s why the new emissions information you see when searching on Google Flights is so important. Our research indicates that people will use this information to choose lower-emissions flights.

Illustration of flight schedule board with blank rows and positive or negative CO2 indicators at the end of each row


How Emissions Information Can Make a Difference

In 2015 we began work on GreenFLY.ucdavis.edu, a demo flight search website that shows the emissions of each flight as prominently as the price, labels the lowest emissions options “Your GreenFLY,” and, by default, sorts flights from lowest to highest emissions. Experimenting with GreenFLY helped us demonstrate the wide variation in emissions among flights with the same origins and destinations, especially for long cross-country or international flights.

We conducted two experiments to test whether this method of providing emissions information on available flight options would nudge travelers toward choosing lower-emitting flights. After all, someone using a flight-search website is already balancing many factors, such as when to fly, price, length of layover and perhaps a favorite airline; why not put emissions into the mix? In our studies we asked people to choose between a few flights, and we used that data to build a predictive model of how much value people put on different factors such as price, layovers, and emissions.

As most other researchers into flight choice have found, price was the most important consideration. But we also found that people were willing to pay more for a lower-emissions flight. For instance, an international flight might emit around a metric ton of carbon (1000kg); and people were willing to pay $20 more for a ticket that avoided 100kg of CO2 emissions, or about 10%. This translates to a rate (“willingness to pay”) of about $200/ton of CO2 saved, much higher than the average price of carbon offsets, which is about $3-6/ton! This surprisingly strong effect was consistent between two studies looking at different populations (one of UC Davis employees and one of more broadly recruited American travelers).

Real-World Emissions Reductions

Our studies presented travelers with hypothetical trips, and our GreenFLY site was just a demo. But now that Google Flights is using an emissions-focused interface, we will have an opportunity to see how emissions information will influence consumer behavior on a huge scale. We’re optimistic that we’ll see an impact on the travel choices of Google Flights’ many users and, possibly, on overall aviation emissions.

The possibilities are exciting. If more travel booking and search platforms follow the lead of Google and others like Kayak, Skyscanner, and Lite Flights, this could have a cascading effect. Many consumers choosing lower-carbon flights could push airlines to invest in more fuel-efficient aircraft as well as sustainable aviation fuels. Repeatedly seeing emissions information could raise traveler’s awareness of the environmental cost of flying. This may ultimately build support for emissions reduction regulations and investments in more sustainable travel alternatives.

###

More information on the authors’ GreenFLY research is available in an NCST ReportNCST Policy Brief, a 2021 Transportation Research Record paper, and a 2017 Design, User Experience, and Usability Conference Paper.


Angela Sanguinetti is a Research Environmental Psychologist at the UC Davis Institute of Transportation Studies and Energy & Efficiency Institute.

Nina Amenta is professor of Computer Science at UC Davis.

Mike Sintetos is Policy Director for the National Center for Sustainable Transportation (NCST) and SB1 Research Program at the UC Davis Institute of Transportation Studies.

Electric, automated, shared mobility in the future: how will people choose? The role of monetary and non-monetary factors

Illustration of money/time balance

Illustration of money/time balance

By Lew Fulton and Mike Sintetos

Much has been written about the three revolutions transforming transportation—automation, electrification, and sharing—and about their potential to shape the future sustainability of the transportation system. Yet it is also important to consider that these profound changes in travel options may also have varying impacts on the environment.

Take, for example, the potential of vehicle automation. Fully automated vehicles may become widely available as a low-cost ride-hailing or private vehicle option within a decade. The lower monetary and time-cost (related to time spent traveling) of automated vehicle travel could dramatically increase vehicle miles traveled, pollution, and traffic congestion, unless policies are put in place to manage a rapidly changing system. Low-cost, driverless ride-hailing trips may also reduce the incentive to pool rides if it reduces the price advantage of pooling. Furthermore, whether the vehicles are electric or gas-powered will be a critical determinant of their environmental impacts.

The relative costs of mode choices, technology choices, and new technology introductions will be a major factor in whether the net effects of these “3 revolutions” add up to more or less traffic, pollution, and greenhouse gas emissions. Fundamental questions to consider include: will future travelers decide to purchase their own automated vehicles or use automated ride-hailing? Will they use fleets of “robo-taxis” primarily for solo trips or will they share those trips with others, reducing traffic impacts? Will they choose electric over gas-powered vehicles in cases where they have a choice? And what factors will go into these decisions?

We have explored these questions in a series of recent papers.

Factors Influencing Travel Choice

Our research explores the many monetary and non-monetary factors that go into people’s travel decisions. Monetary costs related to owning a vehicle include the purchase cost, maintenance, fuel, and parking costs. Among these, some are fixed and some vary, occurring with each trip. The variable costs appear likely to be more influential in short-term decisions about what modes to choose for a given trip (once a car is bought, the purchase cost may be ignored in daily travel decisions). For travel choices such as on-demand ride hailing, all costs are essentially variable, paid for each trip and roughly per mile.

Non-monetary factors also play a big role in traveler mode choices. Travel time, convenience, certainty of departure and arrival times, safety/security concerns, and other factors all play a role in our decisions about how we get from point A to point B. There is considerable research exploring these factors in traditional mode choice contexts, such as driving vs. taking public transit. But it is less clear how these factors will impact choices in our “3 revolutions” future, with its many new types of choices. Which travel choices will appear to be lowest cost in different situations when considering monetary and non-monetary costs together as a “generalized cost”?

To understand how people might make travel decisions in a future with fully automated vehicles, various ride-hailing and sharing options, and the possibility of vehicle electrification, we need to understand the relative values of these different monetary and non-monetary factors and how these generalized costs might compare across travel modes.

Our team used existing research and data estimates, along with some projections of future costs, to develop generalized cost estimates for several future travel modes, including private vehicle travel, solo ride-hailing, and pooled ride-hailing, for electric and gas-powered vehicle technologies, considering the presence of a human driver in the near term analysis and focused on automated vehicles in the 2030-35 timeframe. Our estimates take into account the costs of vehicles, energy, and perhaps most importantly, the value of time during specific trips. We looked at several specific trip situations, focusing mainly on 1) a short-distance, urban trip, and 2) a longer-distance, suburban trip.

Generalized Costs of Future Travel

While we have estimated monetary and some non-monetary costs of travel options, we have ultimately learned that there are many more possible costs than we can realistically estimate values for at this time. One example is the “cost” associated with the hassle of having to remove personal belongings such as child seats from a shared vehicle rather than leaving things in a personal car. We used value of time assumptions to estimate values for a number of factors that have a clear time component, such as the time spent traveling in the vehicle, waiting for a vehicle to arrive, and searching for parking.

Overall, our findings suggest that a few things are likely to occur once automated vehicles are widely available. These are reflected in the figure below, which provides a snapshot of relative costs of modes in 2030 taking into account a range of monetary and non-monetary factors:

  • Not having to drive will save about half the generalized cost of private vehicle trips, as long as people find their time as a passenger somewhat useful and preferable to driving.
  • A driverless ride-hailing trip appears likely to be, from a generalized cost point of view, cheaper than today’s ride-hailing options, including pooled trips, with no need to pay a driver.
  • The reduced monetary cost of both solo and pooled ride-hailing services will shrink pooled ride-hailing’s relative advantage without affecting its non-monetary disadvantages (longer travel time, less predictability, potential safety concerns). Thus, pooled ride-hailing may become even more unappealing in an automated future.
  • While electric vehicles are slightly more expensive (higher purchase cost, mostly offset by lower driving cost), their relative cost differences with conventional vehicles are tiny compared to the various non-monetary costs associated with different modes. Once automation is available, it seems the financial cost of whether a vehicle is electric or not will be relatively unimportant compared to automation-related factors.
Monetary and non-monetary costs for vehicles types - 2030

Figure 1. Monetary and non-monetary costs in 2030 for various vehicle types, for a typical mid-length trip (US dollars/mile) (Source: Estimating the Costs of New Mobility Travel Options: Monetary and Non-Monetary Factors)

All of these costs will vary by situation, by person, and over time as these technologies develop, and while we explore these uncertainties in our papers, we acknowledge that much more work is needed to investigate the range of potential costs. Still, we believe these basic results are likely to hold up across many situations. If one had hoped that the net costs of various trip choices would eventually push people to share rides and reduce vehicle miles traveled, these initial results are not encouraging.

Balancing the Scales

Policies such as pricing strategies (e.g. road tolls and urban access pricing schemes) can tip the balance of costs between modes. In our May 2021 Transport Policy paper, we looked at existing road pricing schemes around the world to understand whether trip fees on solo ride-hailing, per-mile tolls, or congestion-area fees would change the relative attractiveness of solo private vehicle driving vs. ride-hailing. Our analysis showed that, with the exception of London’s daily charge to enter the central city, none of the existing road fee systems create differences that are anywhere near large enough to significantly affect travel choices. These policies tend to create differences (e.g. between solo and shared trips) that are less than $0.10 per mile, while we estimated the generalized cost differences between these modes to be as high as $1.00 per mile.

Therefore, future road pricing policies may need be much more aggressive in terms of creating per-mile cost differentials in order to have considerable impact on overall car travel, ride sharing levels, and shifts away from automobile travel altogether. Without such policies, the low cost of travel in either private or on-demand automated vehicles could lead to even more vehicle travel and roads clogged with single-passenger automated vehicles. One silver lining from our research points to the fact that the relative closeness of the generalized costs of electric vehicles and conventional vehicles may provide a good opportunity to use road pricing to promote electric vehicle adoption—a definite benefit for environmental concerns.

Based on this work, we believe that governments looking to increase the use of pooled ride-hailing to encourage more sustainable travel choices can take several actions:

  • Set ride-hailing fees to meaningfully incentivize pooled travel. Fees on solo trips need to be much higher to make a difference.
  • Prioritize access for pooled travel. Policies that reduce travel times for pooled vehicles, such as curb access or priority lanes, will lower the generalized costs of these modes.
  • Consider per-mile fees or restrictions on personal automated vehicles. The time is now to implement these policies, before AVs are widespread.

If left to develop unregulated, automated vehicle technology may only reinforce our tendency towards solo travel, particularly private automated vehicle travel, and encourage much longer trips, given their lower generalized cost. Early and effective policy action will be needed to avoid this path and ensure a more sustainable transportation future.

Additional Resources

January 2020 Transport Policy paper
May 2021 Transport Policy paper
SB1 Report
NCST Report
Policy Brief

Lew Fulton  is Director of the Sustainable Freight Research Center and the Energy Futures Research Program at the UC Davis Institute of Transportation Studies.

Mike Sintetos is Policy Director for the National Center for Sustainable Transportation (NCST) and SB1 Research Program at the UC Davis Institute of Transportation Studies.

UC Davis Environmental Justice & Equity Leadership Fellowship Program Description

2022 UC Davis Environmental Justice Fellowship

Fellowship Flyer

Application Opens: September 20, 2021
Online Open House Session: TBD
Application Deadline: November 1, 2021
Program Start: January 2022

To immerse community expertise into academic research and public policy, the UC Davis Institute of Transportation Studies (ITS-Davis),  the Energy and Efficiency Institute (EEI), the Center for Regional Change, in collaboration with members of the Transportation Equity and the Environmental Justice Advisory Group (TEEJAG), are launching the Environmental Justice Fellowship program (EJF). This fellowship program will benefit participating fellows, the communities they serve, and the university researchers they engage with.

The EJF Program will begin in January 2022.

Motivation

This fellowship program aims to address two challenges: 1) communities have untapped knowledge that is not disseminated widely or is ignored by government and other entities, due to physical distance, language barriers, cost, and lack of access to information; and 2) the research community has untapped knowledge and expertise but has historically shared an asymmetrical power balance with environmental justice (EJ) advocacy groups and community organizations. The result, all too often, has led to limited sharing of information between academia and EJ communities, poor public engagement, and missed opportunities to improve public policy.  This fellowship program will connect university-based research programs and personnel with community expertise and knowledge.

Topics of Interest

This program is being developed with a particular focus on these key research areas:

  • Equity in electric vehicles: incentives and infrastructure
  • Indoor air quality upgrades
  • Outdoor air quality mitigation
  • Greening without gentrification
  • Science-based energy efficiency
  • Improve buildings electrification
  • Transit service: availability, access, and cost
  • Safe streets and active transportation
  • Shared mobility and increased mobility options
  • Transit-oriented developments and affordable housing
  • Decarbonization efforts including Low Carbon Fuel Standard

Program Design

The program will be co-created by the fellows and the UC Davis Environmental Justice Team formed by EJ experts. This program will last six months with support for up to three in-person sessions in Davis, California. Fellows will be given flexibility to customize the program according to their interests. Fellows will be expected to participate in some or all of the following activities:

  • Professional Development
    • Participation in weekly seminar series and classes, and curated briefings with local, state, and federal legislators, and other regulatory agencies in the EJ space
  • Leadership by the fellows
    • Integrate lived experience and community knowledge into the research process
    • Provide guest lectures and/or co-teach courses
    • Co-organize workshops and/or webinars
  • Capstone Project
    • Complete a white paper, presentation, and/or grant proposal that will advance equity
  • Professional Network
    • Continued engagement with fellows and networking events

Eligibility

An Environmental Justice Fellow is an experienced environmental justice activist or community leader, aiming to advance and scale their goals, who are also willing to co-design this program. Individuals committed to advancing EJ are encouraged to apply, including those who may or may not be part of non-government organizations (NGOs), research-advocacy groups, community-based organizations (CBOs), and/or advocacy groups. Those from historically underrepresented backgrounds, including Black, Indigenous, People of Color (BIPOC), and those with intersecting identities (queer, trans, immigrant, and disabled), are strongly encouraged to apply.

Commitment

The Fellows should be able to commit a minimum of 8 hours a week to this program. Candidates are encouraged to be involved beyond that time depending on their availability. The goal is to provide enough flexibility to allow Fellows to continue to work for and support their respective organizations, while remaining fully engaged in the activities mentioned in the Program Design (above) for a productive and impactful fellowship experience.

Prospective Fellows

If you are interested in being considered for this Fellowship, please complete the following application by Monday, November 1, 2021 (PST 11:55).

Our team is asking individuals interested in being considered for this fellowship to submit an application, including all those that had previously applied in summer 2021. To submit an application, please complete the following 2-step process:

  1. Complete an updated application HERE. (Deadline: Monday, November 1, 2021)
  2. Send your resume via email to: EJF_Res.80nwtzhf6qbb58dt@u.box.com (you can copy and paste into the outgoing email address)
    1. Please upload your resume as DOC or PDF (Max size 20-25 MB)
    2. Name your file as: LastName_FirstName_resume (ex. Doe_John_resume)
    3. You will receive a confirmation email once your resume is received

The EJF selection committee will review applications and inform selected Fellows by Monday, November 15th, 2021.

The coordinating team will be hosting a virtual Open House on Wednesday, October 27 at 12pm. The purpose of this virtual event is to provide candidates an opportunity to ask questions and/or comment directly to the coordinating team. If you are interested in participating please register to receive the information for this event. Thank you for your time and we look forward to hearing from you.

For questions, please contact our program coordinators JC Garcia Sanchez (jcgarciasanchez@ucdavis.edu) and Terra Arnal Luna (tarnal@ucdavis.edu).

Please feel free to download this PDF version for sharing by email to colleagues.

City and County Pavement Improvement Center (CCPIC): Supporting Local Government to Make Their Pavements Better

Better Pavements

If we are going to operate ground transportation, we are going to need pavement, regardless of how those vehicles (cars, trucks, bicycles, feet) are powered. Leaving aside the question of how much pavement we want or need, pavements directly contribute to global warming throughout their life cycle. They require: materials extraction and production, transport, construction, maintenance, rehabilitation, reconstruction, and demolition (“end-of-life,” although they seldom really die, they get reused or repurposed). Pavements also affect vehicle emissions by impacting vehicle life-span and the amount of energy needed to propel vehicles.

To reduce emissions and help local governments maximize the value of their pavement dollars, a group of California universities and local governments created the City and County Pavement Improvement Center (CCPIC). The center provides cities and counties with training, tools, guidance, and outreach regarding advanced, cost-effective, and sustainable pavement practices. Many of these are available through the CCPIC website.

The CCPIC resources address the three main strategies that are currently used to reduce global warming emissions from the pavement life cycle:

  • Better engineering and construction quality at the outset of a project to minimize the environmental impacts of subsequent maintenance and rehabilitation. About 95% of all pavement spending is on keeping existing pavement functional.
  • Keeping pavements smooth and choosing the best pavement type to reduce vehicle fuel use and prolong vehicle life.
  • Better timing and treatment selection in pavement maintenance and rehabilitation through improved use of pavement management systems. These systems include low-impact preservation treatments and selection of optimal rehabilitation strategies for the pavement type and condition, climate, and traffic.

One of the projects that used CCPIC resources was the Fulton Road Reconstruction, in Santa Rosa, which won the 2021 overall award in the California’s Outstanding Local Streets and Roads Project Awards. The section of road reconstructed has 25,000 vehicles traveling on it in each direction every day. The project used a draft version of the model PCC Pavement Specifications from the CCPIC for the design of the materials and construction. Because of these and other strategies used on the renovation project, it is expected to require minimal maintenance and last longer—which will conserve funding, reduce environmental impact, and eliminate additional road work leading to traffic delays and hazards.

The CCPIC will continue expanding its training program, launching a pavement engineering and management certificate program, producing more model specifications, software tools, and technical guidance, and continuing outreach to local agencies. Support for CCPIC comes from SB1 funds from the UC Institute of Transportation Studies (Davis, Berkeley, Los Angeles and Irvine) and the California State University Transportation Consortium (Mineta Transportation Institute).

———

John Harvey is a professor of Civil and Environmental Engineering at UC Davis and Director of the UC Pavement Research Center and the City and County Pavement Improvement Center.

Transportation for the Medically Vulnerable During COVID-19

Vaccinations are offering restored hope, but questions remain about whether transportation access will restrict an equitable vaccine distribution strategy. According to Pew, millions of people who may be higher-risk for contracting COVID-19 also don’t have a reliable transportation option to a vaccine location. Older adults, medically frail individuals, and those living in communities hardest hit by the pandemic often overlap with those with limited transportation access.

Vaccination campaigns across the U.S. are addressing these transportation challenges. In Los Angeles, New York, Boston and Denver some programs are offering door-to-door vaccine distribution. These vaccine distribution programs may be the ticket to address the fact that COVID-19 has disrupted all forms of transportation, and particularly harmed the vulnerable in a number of ways. UC Davis research on the impacts of COVID-19 shows that the pandemic has exacerbated income inequalities.

Those who need periodic non-emergency healthcare have been particularly vulnerable during the pandemic. Even now, during the transition back to normalcy, this group is facing many new challenges, as well as some unique opportunities.

Illustration of person exiting a bus and pushing another person in a wheelchair

Who has Access to Telehealth

The COVID-19 pandemic has transformed healthcare delivery in the United States. The Centers for Medicare and Medicaid Services rapidly expanded telehealth services for many patients in response to the COVID-19 public health emergency. Telehealth has been promoted as a way for patients to minimize their risk of infection and to reduce exposures to healthcare teams.

Despite these expansions, many patients and clinics, particularly those that service vulnerable populations, have not benefited from this rapid transition to telehealth. Some patients lack the technology (computer, tablet, phone), broad-band internet, or comfort to access these services. In addition, language barriers add an additional barrier at times. Finally, despite the rise of telehealth, certain patients require continued in-person visits. Clearly, vaccines or physical treatments cannot be administered digitally. Given the changing landscape of transportation due to the pandemic, this may be placing already vulnerable patients at even higher risk.

Addressing the Unique Needs of Dialysis Patients

Individuals with End Stage Kidney Disease (ESRD) on hemodialysis are one such group of patients who need in-person medical care despite the ongoing pandemic. The vast majority of patients on hemodialysis need to travel to a dialysis center about three times a week for their scheduled treatment. The pandemic transformed clinical practice for dialysis centers and patients. Additionally, with changing public transportation schedules and opportunities during the pandemic, these patients potentially face additional challenges. Many patients on dialysis may require shared rides or non-emergency medical transportation (NEMT) services, such as paratransit services. Such services typically combine multiple riders into one van. Given the increased risk of COVID transmission in enclosed spaces and the higher risk of COVID to patients with ESRD, many paratransit operators are offering single-ride service. Some paratransit operators are restricting rides for non-essential trips to keep service vehicles available for people who need medical appointment support. The CDC also suggests considering the use of larger cutaway buses for paratransit vehicles to ensure adequate distance between riders.

Is Paratransit Service Meeting the Need?

However, as the pandemic wanes, these strategies may have a profound and long-term effect on paratransit riders, and delayed or avoided healthcare visits may harm those most vulnerable. Increasing paratransit service vehicles can be cost prohibitive for many cash-strapped transit agencies because paratransit service is typically the most expensive option.

Several cities and agencies have partnerships that divert paratransit trip requests to taxi or ridehailing companies to provide additional service options and reduce costs of paratransit service, which can be as much as $45 for a wheelchair accessible ride. In Boston, paratransit riders can call an Uber or a Lyft ride for as little as $2 with the MBTA covering up to $40 of the ride costs. In Southern Nevada there is a similar program offering $3 rides on Lyft, with the rest of the ride cost subsidized by the Regional Transportation Commission.

Public private partnerships may offer a blended model, allowing agencies to keep operating service vehicles or employing drivers in-house, and relying on private companies to fill in  the gaps. This can address concerns from labor advocates and ensure community control over the service provision.

Via microtransit offers such a blended service, providing an on-demand app for riders and drivers to connect, drivers, shuttle vans, or a combination of these options. In Ohio, COTA Plus is operated by Via, and provides area residents with an on-demand transit option. In the past year, COVID-19 protocols caused the COTA Plus service to limit only 2 passengers in their 6-9 seat vans. While this may be less efficient, it highlights how the  community can continue to use them safely, changing the service to meet the needs of the pandemic.

Looking Forward

Now may be a time of enormous reinvention on the part of cities, agencies and governments. It may be a time to think creatively about solutions that can prevent the type of transportation access challenges that become more deadly during emergencies like the pandemic. Agencies must look for new solutions to improve mobility options for vulnerable populations, while reducing  costs for paratransit service.

The full-scale effect of the pandemic on mobility, health, and ease of access to health services is still unknown. But if the pandemic results in improved mobility for dialysis patients, better telehealth options for patients with chronic health needs, and improved vaccine distribution methods, the challenges of the COVID pandemic may indeed have a silver lining.

Na’amah Razon is a Clinical and Research Fellow at the Philip R. Lee Institute for Health Policy Studies in the Department of Family and Community Medicine at the University of California, San Francisco

Mollie D’Agostino is Policy Director of the 3 Revolutions Future Mobility Research Program at ITS-Davis

At the time of writing, Austin Brown was Executive Director of the Policy Institute for Energy, Environment, and the Economy at ITS-Davis.

We Can, and Should, Account for the Consequences of Expanding Highways

Illustration of traffic congestion

Illustration of traffic congestion

In 2019, a California lawmaker introduced legislation to use money from the state’s Greenhouse Gas Reduction Fund to add vehicle lanes to both of California’s major north-south highways. The bill reasoned that the additional lanes would “decrease traffic congestion and thereby decrease the emissions of greenhouse gases caused by automobiles.”

Think about that for a moment. A proposal to take funds reserved for reducing greenhouse gas emissions and spend them on projects that would make space for even more cars on California’s highways.

While the bill went nowhere, it illustrates the pervasiveness of the flawed logic that highways clogged with traffic can simply be widened to relieve congestion, speed up traffic, and even clean the air. The reality is just the opposite, because of a phenomenon known as the induced travel effect. Researchers at UC Davis have developed a simple tool to estimate this effect and understand the true impacts of widening highways on vehicle miles traveled and pollution.

The induced travel effect

Decades of research have shown the existence of the induced travel effect. This phenomenon can be explained by the basic economic principles of supply and demand. Expanding highway capacity increases average travel speed (at least initially), which reduces the time “cost” of driving. When the cost of driving decreases, the volume of (or “demand” for) driving increases, as is true for most economic goods.

This added driving can come from shifts to driving from non-auto travel modes, shifts in destinations and driving routes, and entirely new trips. All of this additional driving can ultimately return highway traffic congestion to pre-expansion levels.

Figure 1. A schematic of the induced travel effect.

Figure 1. A schematic of the induced travel effect.

Studies consistently suggest that the elasticity of the induced travel effect—the rate at which driving increases after expanding a highway—is close to 1.0 in the long term. This means that for every 10% increase in highway capacity, vehicle miles traveled will increase by close to 10% within 5 to 10 years, canceling out any congestion reduction benefits.

However, this overwhelming evidence has not prevented generations of traffic engineers from proposing and building highway expansions with the stated goal of “congestion relief.”

How can we account for induced travel?

Even when transportation departments acknowledge the induced travel effect, they often argue that the additional driving is adequately estimated through travel demand models. The problem is that most travel demand models don’t fully account for induced travel. To address this problem, our research team developed a simple but powerful tool to estimate the additional vehicle miles traveled induced by adding highway capacity in California.

The Induced Travel Calculator is a publicly available, online tool that agencies and stakeholders can use to estimate the vehicle miles traveled induced annually by adding lanes to major roadways in counties in California’s metropolitan areas. This estimation of induced vehicle miles traveled can be used to calculate corresponding increases in greenhouse gas emissions and pollution. The calculator bases its estimates on a project’s length in lane miles, data from Caltrans on regional lane-miles and vehicle miles traveled, and estimates of elasticities from published research. Using the calculator can provide a consistent assessment of the true impacts of adding highway lanes.

We applied our calculator to five highway expansion projects approved in California over the last 12 years. The agency overseeing each project completed an environmental review, as required by federal and state law, to help decision-makers and the public weigh the project’s potential costs and benefits. We found that only three of these environmental reviews estimated induced travel effects. All three estimates were lower—two were more than 10 times lower—than our estimates from the Induced Travel Calculator.


Figure 2. A comparison of induced vehicle miles traveled as estimated in highway expansion projects’ environmental analyses (if done) vs. the induced travel calculator.

Figure 2. A comparison of induced vehicle miles traveled as estimated in highway expansion projects’ environmental analyses (if done) vs. the induced travel calculator.

These projects, all of which were proposed with a goal of reducing traffic congestion, appear to have over-promised their congestion relief benefits while not fully disclosing the added traffic, local air pollution, and greenhouse gas emissions they will cause.

The role of policy

Caltrans has recently taken a significant step toward accounting for the effects of induced travel. For the first time, it issued guidance on measuring induced travel and recommends using our Induced Travel Calculator when applicable. These efforts stem from new state requirements to analyze the impacts of proposed projects on vehicle miles traveled, under the California Environmental Quality Act. While the calculator is tailored to California, it could easily be adapted for use in other states. For example, City Observatory recently adapted the calculator for the Portland, Oregon metropolitan area.

As the new US Department of Transportation leadership contemplates taking up greenhouse gas performance measure regulations previously issued under the Obama administration and rescinded by the Trump administration, it should ensure that states tracking emissions from their highway systems are accurately accounting for the effects of adding highway lanes. A recently introduced bill in Congress would do just that, requiring state and regional governments to publish an analysis of how proposals to increase highway capacity would affect vehicle miles traveled.

Reducing transportation greenhouse gas emissions has been stubbornly difficult. The task is made even harder by highway widening projects, which accommodate more driving. A clear-eyed assessment of these projects’ true impacts is an important first step toward reversing this trend.


More information on the Induced Travel Calculator is available in a 2-page policy brief, 14-page research report, more detailed journal article, and recorded webinar.

Jamey Volker is a Postdoctoral Researcher at the National Center for Sustainable Transportation, led by the UC Davis Institute of Transportation Studies. 

Mike Sintetos is the Policy Director for the National Center for Sustainable Transportation and the University of California Institute of Transportation Studies (UC ITS) Statewide Transportation Research Program at the UC Davis Institute of Transportation Studies.

No, electric vehicles aren’t driven less than gas cars

To design the best electric vehicle policies—affecting their sale, manufacturing, and charging—we need to know whether electric vehicles can function as replacements for gasoline vehicles. Addressing this question is controversial and important. Bringing clarity is critical because some interest groups opposed to electric vehicles state that less usage indicates that electric vehicles are an inferior substitute for gasoline cars, and thus not deserving of government support.

Illustration of EVs balanced on a scale with label "Miles Driven per Year"

Some studies from 2019 and 2021 suggest that electric vehicles are driven much less than gasoline vehicles. Our research and data tell a very different story. We find overwhelming evidence that electric vehicles are driven as much as, if not more than, gasoline vehicles. We focus on battery electric vehicles (EVs), since those are the most hotly debated, though we also present data from plug-in hybrids.

Using multiple sources of data, we find that battery EVs are driven on average about 11,000 to 13,000 miles per year, while gasoline vehicles are driven about 9,000 to 11,000 miles per year. Our estimate of annual EV miles is much higher than previous studies report. There are three explanations: (1) prior studies used data mostly from short range EVs; (2) the range of newer EVs is much greater; and (3) data collection methods in earlier studies had certain biases and limitations.

On the issue of increasing driving range: five years ago, most EVs had a range of around 80 miles. These vehicle models have been largely phased out. Today there are 13 EV models with more than 200 miles of range. These longer-range models tend to be driven more and now dominate the market. In 2020, only 448 EVs with less than 100 miles of range were sold in the United States, compared to 251,333 EVs with more than 200 miles of range.

On the issue of data collection: previous studies were based not only on shorter range vehicles, but, in some cases, they underestimated vehicle miles traveled based on measures of at-home charging, without accurately measuring away-from-home charging or hybrid miles traveled by plug-in hybrid vehicles.

To address the debate on EV use, we analyzed four datasets—from the outdated 2017 National Household Travel Survey (NHTS), the California Energy Commission 2019 Consumer Vehicle Survey, and two UC Davis studies. One of these two UC Davis studies used the most reliable source of electric miles traveled—measurements from data recorders on board vehicles. The second used data from multi-year questionnaire surveys completed by 19,304 EV and plug-in hybrid owning households, a far larger sample with a greater variety of households and vehicles than the samples in other data sets (for information on this survey see here and here). The figure below shows the results from each data set for all EVs (i.e., all ranges), short-range EVs, long-range EVs, plus plug-in hybrids, gasoline hybrid vehicles, and gasoline cars.

Chart showing average annual miles driven by EVs

EVs are driven as much as, or more than, gasoline vehicles. In this chart, the average annual vehicle miles travelled for each vehicle type is shown, with the bars color coded to indicate the source of the data. (Figure adapted from this UC Davis report.)

As the figure shows, the NHTS data (dark blue bar at the top of each set) gives the lowest estimate of miles traveled for EVs of different ranges and plug-in hybrids (top vehicle types in the figure). The NHTS data set is, however, the least current of the data sets shown and the most affected by factors that lead to underestimating electric miles traveled. Namely, it is based on early, short-range models of electric vehicles and early adopter households with older drivers, retirees, and multiple vehicles. All of these differences would lead to lower overall electric vehicle mileage.

In contrast to the NHTS data, the more current data sources, and those more representative of the existing EV market, indicate that even newer short-range EVs (ranges under 120 miles) are driven an average of 10,060-10,980 miles annually; with long-range EVs (range over 200 miles) reaching 10,940-14,996 miles annually; and plug-in hybrids logging 12,500-13,640 miles annually.

Before discounting the benefits of electric vehicles based on how much they are driven, we need to keep in mind the limitations of the different sources of data, as well as the characteristics of the electric vehicle owners surveyed. Large-scale data from automakers’ telematic systems or on-board recorders would be optimal but are not available. For now, data from surveys like the UC Davis survey and data from on-board recorders may offer the best available estimate of how EVs and plug-in hybrids are being used in the real-world.

In summary, all the recent direct sources of data that we investigated indicate that, contrary to some reports, both EVs and plug-in hybrids are driven at least as much as gasoline vehicles. These results and the debates around electric vehicle use highlight the need for research and data collection focused on understanding how electric vehicles integrate into households. This research will become even more relevant as regions, including California, work towards goals of 100% new vehicle sales being electric, and as these regions base their regulations and incentives on how those vehicles are used.

Debapriya Chakraborty, is a postdoctoral researcher with the Plug-In Hybrid and Electric Vehicle Research Center at ITS-Davis

Scott Hardman, Ph.D. is a professional research scientist with the Plug-In Hybrid and Electric Vehicle Research Center at ITS-Davis and manages the International EV Policy Council   

Seth Karten is the Science Writer at ITS-Davis

Gil Tal is the Director of the Plug-in Hybrid and Electric Vehicle Research Center at ITS-Davis

California’s ZEV Rule a Model, This Time for Korea, With Help From ITS-Davis Researchers

Transportation and Climate Blog: California’s ZEV Rule a Model, This Time for Korea, With Help From ITS-Davis Researchers

Here’s a major policy success of 2020 that probably slipped by most people in the United States: Korea, the sixth-largest producer of automobiles and home to the third-largest automotive group in the world (Hyundai-Kia), successfully implemented its own zero emissions vehicle (ZEV) sales regulation—with help from ITS-Davis researchers.

Korea’s ZEV rule is fashioned after California’s ZEV mandate, which is widely credited with the commercialization of ZEVs globally and is one reason California is the leading US state for electric vehicle sales. ITS-Davis researchers have contributed to the evolution of the ZEV regulation since the early 1990s by providing independent analysis of vehicle technologies; environmental and economic impact studies; and consumer behavior research to enhance market understanding.

ITS-Davis’s involvement with Korea’s ZEV rule grew out of a relationship between the UC Davis Plug-in Hybrid & Electric Vehicle (PH&EV) Research Center and the Korea Transport Institute (KOTI), a government think tank responsible for ZEV policy and research. KOTI participates on the International EV Policy Council, a PH&EV Research Center-led program that brings together international scientists, academics, and researchers to build an in-depth understanding of global electric vehicle market developments backed-up by empirical evidence.

In 2018, a team of researchers from the PH&EV Center—including Alan Jenn, Jae Hyun Lee and Scott Hardman—traveled to Seoul to meet with researchers from KOTI to exchange research findings. The ITS team learned that although Korea offered strong financial incentives for ZEVs and had ample charging infrastructure, vehicle supply was lacking. Most of the ZEVs produced in Korea were being exported to markets like Norway and the United States. Few were available domestically.

The Korean government, which until then had not adopted national EV policies, was shaken by severe air pollution episodes in 2018 and 2019 and widespread public demand for cleaner air and eco-friendly car policies. As a result, it appointed KOTI to research and design the Korean ZEV sales regulation.

KOTI tapped the collective expertise of ITS-Davis and the International EV Policy Council. ITS-Davis provided direct and indirect assistance in the drafting of Korea’s ZEV regulation. The EV Policy Council provided international policy expertise to inform Korea’s policy development process. It also facilitated a 2019 workshop in Davis attended by a Korean delegation and representatives from the California Air Resources Board (CARB). The ITS-Davis team and CARB experts provided feedback on a draft of the Korean regulation and suggested changes to increase its effectiveness in meeting its goals of ZEV sales and improved air quality. Their recommendations included increasing the ZEV sales target, adjusting the credit calculating system, and implementing a penalty system for non-compliance. Korean officials incorporated the recommended changes into their regulation and it continued through the regulatory process.

In large part due to the work of KOTI, Korea’s ZEV regulation was introduced and passed in April 2020 as the Clean Air Conservation Act Chapter 4 Article 58-2 “Deployment of low-emission Vehicles”. Korea’s ZEV credit target, like California’s, is 22% of vehicles sold in 2025. The regulations in Korea and California require automakers to annually accrue a minimum number of ZEV credits, which are awarded for each ZEV sold, based on vehicle characteristics such as range. Korea’s per-vehicle credit calculations mirror California’s, though credits are capped at 3 per vehicle rather than 4. (For background on how California’s and other jurisdictions’ ZEV policies work, see this International EV Policy Council brief.) Unlike California’s rule, Korea’s credit calculation accounts for vehicle efficiency in addition to ZEV range (see figure). Also unlike California’s rule, compliance with Korea’s ZEV rule is voluntary at present to allow automakers time to plan their compliance strategies. After 2023, penalties for non-compliance will be introduced.

The regulation does not yet set overly ambitious targets for ZEV sales. However, Korea now has a regulatory framework into which larger ZEV sales targets, including 100% ZEV sales, can be introduced. Furthermore, the regulation signals Korea’s desire to support a transition to ZEVs to improve urban air quality and reduce greenhouse gas emissions.

As more nations consider ways to transition to 100% electric vehicle sales, a ZEV requirement may provide a regulatory route for reaching these targets. A ZEV regulation can create certainty for automakers by providing a clear pathway of ZEV sales that ramps up from single digit percentages to 100% of the market.

ZEV Credits by Electric Driving Range in California and Korea

Low efficiency Korea calculation assumes battery electric vehicle (BEV) efficiency of 5.3 km/kWh (Kia Niro BEV). High efficiency Korea calculation assumes 8.2 km/kWh (Hyundai Ioniq BEV). Electric driving range assumes EPA ranges for California and WLTP ranges for Korea (converted to miles from kilometers).

Acknowledgements

The authors acknowledge ClimateWorks Foundation and the Paul G. Allen Family Foundation for funding the work of the International EV Policy Council.


Scott Hardman, Ph.D. is a professional research scientist at the Institute of Transportation Studies, University of California, Davis and manages the International EV Policy Council 

Jiyoung Park, Ph.D. is a senior researcher at The Korea Transport Institute (KOTI) and a member of the International EV Policy Council