Category: Transportation and Climate Blog

Transportation for the Medically Vulnerable During COVID-19

Vaccinations are offering restored hope, but questions remain about whether transportation access will restrict an equitable vaccine distribution strategy. According to Pew, millions of people who may be higher-risk for contracting COVID-19 also don’t have a reliable transportation option to a vaccine location. Older adults, medically frail individuals, and those living in communities hardest hit by the pandemic often overlap with those with limited transportation access.

Vaccination campaigns across the U.S. are addressing these transportation challenges. In Los Angeles, New York, Boston and Denver some programs are offering door-to-door vaccine distribution. These vaccine distribution programs may be the ticket to address the fact that COVID-19 has disrupted all forms of transportation, and particularly harmed the vulnerable in a number of ways. UC Davis research on the impacts of COVID-19 shows that the pandemic has exacerbated income inequalities.

Those who need periodic non-emergency healthcare have been particularly vulnerable during the pandemic. Even now, during the transition back to normalcy, this group is facing many new challenges, as well as some unique opportunities.

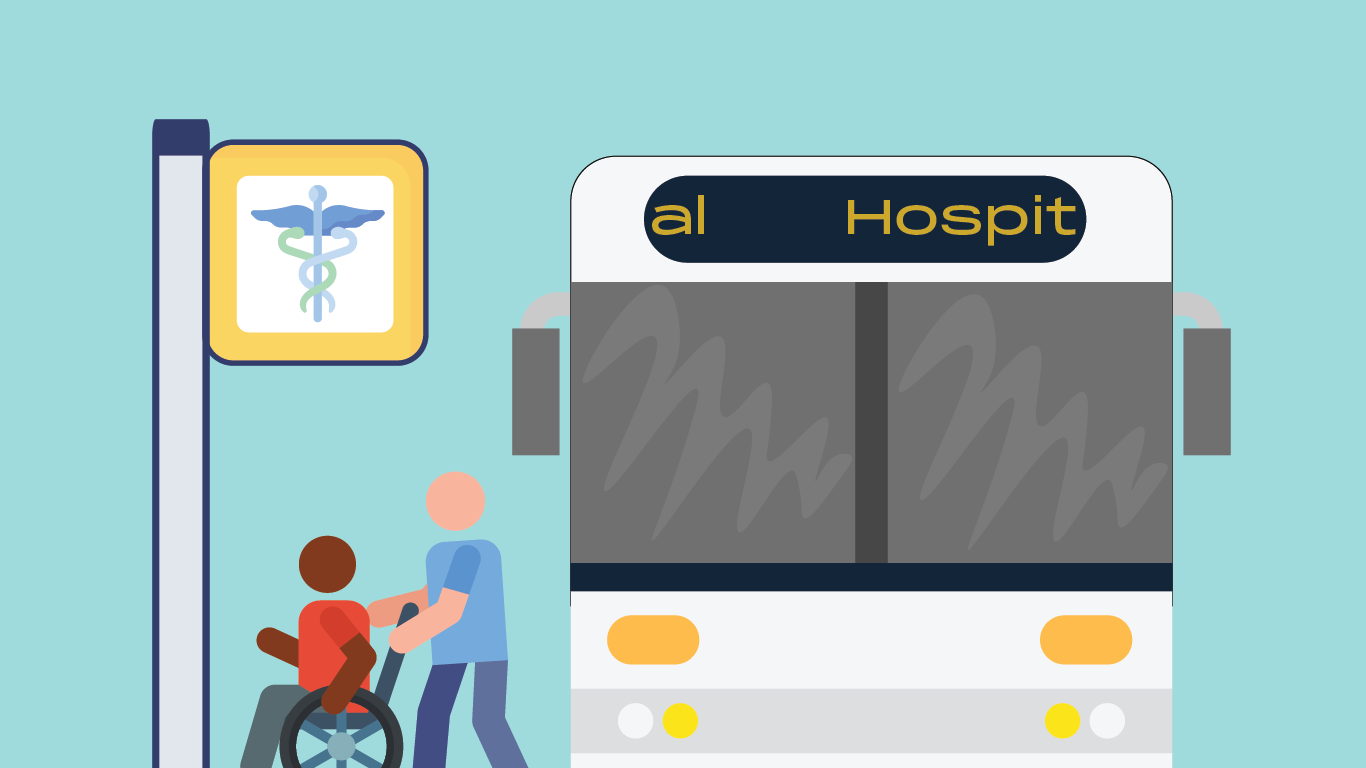
Illustration of person exiting a bus and pushing another person in a wheelchair

Who has Access to Telehealth

The COVID-19 pandemic has transformed healthcare delivery in the United States. The Centers for Medicare and Medicaid Services rapidly expanded telehealth services for many patients in response to the COVID-19 public health emergency. Telehealth has been promoted as a way for patients to minimize their risk of infection and to reduce exposures to healthcare teams.

Despite these expansions, many patients and clinics, particularly those that service vulnerable populations, have not benefited from this rapid transition to telehealth. Some patients lack the technology (computer, tablet, phone), broad-band internet, or comfort to access these services. In addition, language barriers add an additional barrier at times. Finally, despite the rise of telehealth, certain patients require continued in-person visits. Clearly, vaccines or physical treatments cannot be administered digitally. Given the changing landscape of transportation due to the pandemic, this may be placing already vulnerable patients at even higher risk.

Addressing the Unique Needs of Dialysis Patients

Individuals with End Stage Kidney Disease (ESRD) on hemodialysis are one such group of patients who need in-person medical care despite the ongoing pandemic. The vast majority of patients on hemodialysis need to travel to a dialysis center about three times a week for their scheduled treatment. The pandemic transformed clinical practice for dialysis centers and patients. Additionally, with changing public transportation schedules and opportunities during the pandemic, these patients potentially face additional challenges. Many patients on dialysis may require shared rides or non-emergency medical transportation (NEMT) services, such as paratransit services. Such services typically combine multiple riders into one van. Given the increased risk of COVID transmission in enclosed spaces and the higher risk of COVID to patients with ESRD, many paratransit operators are offering single-ride service. Some paratransit operators are restricting rides for non-essential trips to keep service vehicles available for people who need medical appointment support. The CDC also suggests considering the use of larger cutaway buses for paratransit vehicles to ensure adequate distance between riders.

Is Paratransit Service Meeting the Need?

However, as the pandemic wanes, these strategies may have a profound and long-term effect on paratransit riders, and delayed or avoided healthcare visits may harm those most vulnerable. Increasing paratransit service vehicles can be cost prohibitive for many cash-strapped transit agencies because paratransit service is typically the most expensive option.

Several cities and agencies have partnerships that divert paratransit trip requests to taxi or ridehailing companies to provide additional service options and reduce costs of paratransit service, which can be as much as $45 for a wheelchair accessible ride. In Boston, paratransit riders can call an Uber or a Lyft ride for as little as $2 with the MBTA covering up to $40 of the ride costs. In Southern Nevada there is a similar program offering $3 rides on Lyft, with the rest of the ride cost subsidized by the Regional Transportation Commission.

Public private partnerships may offer a blended model, allowing agencies to keep operating service vehicles or employing drivers in-house, and relying on private companies to fill in  the gaps. This can address concerns from labor advocates and ensure community control over the service provision.

Via microtransit offers such a blended service, providing an on-demand app for riders and drivers to connect, drivers, shuttle vans, or a combination of these options. In Ohio, COTA Plus is operated by Via, and provides area residents with an on-demand transit option. In the past year, COVID-19 protocols caused the COTA Plus service to limit only 2 passengers in their 6-9 seat vans. While this may be less efficient, it highlights how the  community can continue to use them safely, changing the service to meet the needs of the pandemic.

Looking Forward

Now may be a time of enormous reinvention on the part of cities, agencies and governments. It may be a time to think creatively about solutions that can prevent the type of transportation access challenges that become more deadly during emergencies like the pandemic. Agencies must look for new solutions to improve mobility options for vulnerable populations, while reducing  costs for paratransit service.

The full-scale effect of the pandemic on mobility, health, and ease of access to health services is still unknown. But if the pandemic results in improved mobility for dialysis patients, better telehealth options for patients with chronic health needs, and improved vaccine distribution methods, the challenges of the COVID pandemic may indeed have a silver lining.

Na’amah Razon is a Clinical and Research Fellow at the Philip R. Lee Institute for Health Policy Studies in the Department of Family and Community Medicine at the University of California, San Francisco

Mollie D’Agostino is Policy Director of the 3 Revolutions Future Mobility Research Program at ITS-Davis

At the time of writing, Austin Brown was Executive Director of the Policy Institute for Energy, Environment, and the Economy at ITS-Davis.

We Can, and Should, Account for the Consequences of Expanding Highways

Illustration of traffic congestion

Illustration of traffic congestion

In 2019, a California lawmaker introduced legislation to use money from the state’s Greenhouse Gas Reduction Fund to add vehicle lanes to both of California’s major north-south highways. The bill reasoned that the additional lanes would “decrease traffic congestion and thereby decrease the emissions of greenhouse gases caused by automobiles.”

Think about that for a moment. A proposal to take funds reserved for reducing greenhouse gas emissions and spend them on projects that would make space for even more cars on California’s highways.

While the bill went nowhere, it illustrates the pervasiveness of the flawed logic that highways clogged with traffic can simply be widened to relieve congestion, speed up traffic, and even clean the air. The reality is just the opposite, because of a phenomenon known as the induced travel effect. Researchers at UC Davis have developed a simple tool to estimate this effect and understand the true impacts of widening highways on vehicle miles traveled and pollution.

The induced travel effect

Decades of research have shown the existence of the induced travel effect. This phenomenon can be explained by the basic economic principles of supply and demand. Expanding highway capacity increases average travel speed (at least initially), which reduces the time “cost” of driving. When the cost of driving decreases, the volume of (or “demand” for) driving increases, as is true for most economic goods.

This added driving can come from shifts to driving from non-auto travel modes, shifts in destinations and driving routes, and entirely new trips. All of this additional driving can ultimately return highway traffic congestion to pre-expansion levels.

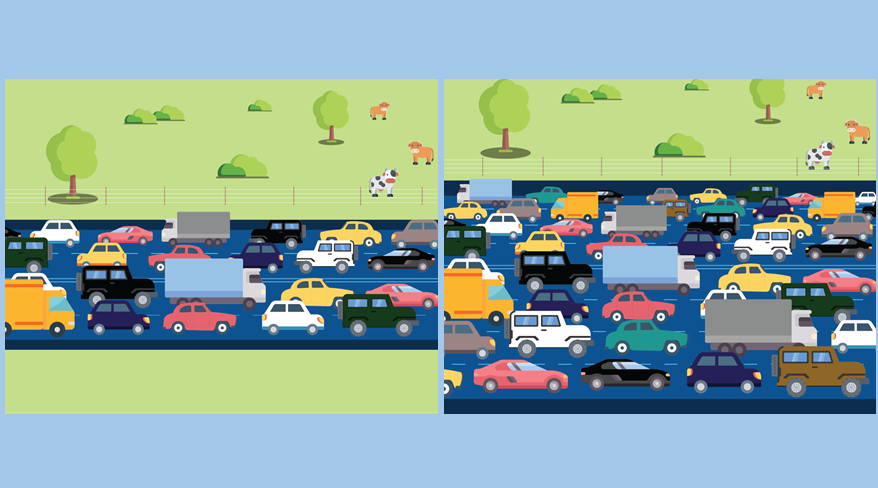
Figure 1. A schematic of the induced travel effect.

Figure 1. A schematic of the induced travel effect.

Studies consistently suggest that the elasticity of the induced travel effect—the rate at which driving increases after expanding a highway—is close to 1.0 in the long term. This means that for every 10% increase in highway capacity, vehicle miles traveled will increase by close to 10% within 5 to 10 years, canceling out any congestion reduction benefits.

However, this overwhelming evidence has not prevented generations of traffic engineers from proposing and building highway expansions with the stated goal of “congestion relief.”

How can we account for induced travel?

Even when transportation departments acknowledge the induced travel effect, they often argue that the additional driving is adequately estimated through travel demand models. The problem is that most travel demand models don’t fully account for induced travel. To address this problem, our research team developed a simple but powerful tool to estimate the additional vehicle miles traveled induced by adding highway capacity in California.

The Induced Travel Calculator is a publicly available, online tool that agencies and stakeholders can use to estimate the vehicle miles traveled induced annually by adding lanes to major roadways in counties in California’s metropolitan areas. This estimation of induced vehicle miles traveled can be used to calculate corresponding increases in greenhouse gas emissions and pollution. The calculator bases its estimates on a project’s length in lane miles, data from Caltrans on regional lane-miles and vehicle miles traveled, and estimates of elasticities from published research. Using the calculator can provide a consistent assessment of the true impacts of adding highway lanes.

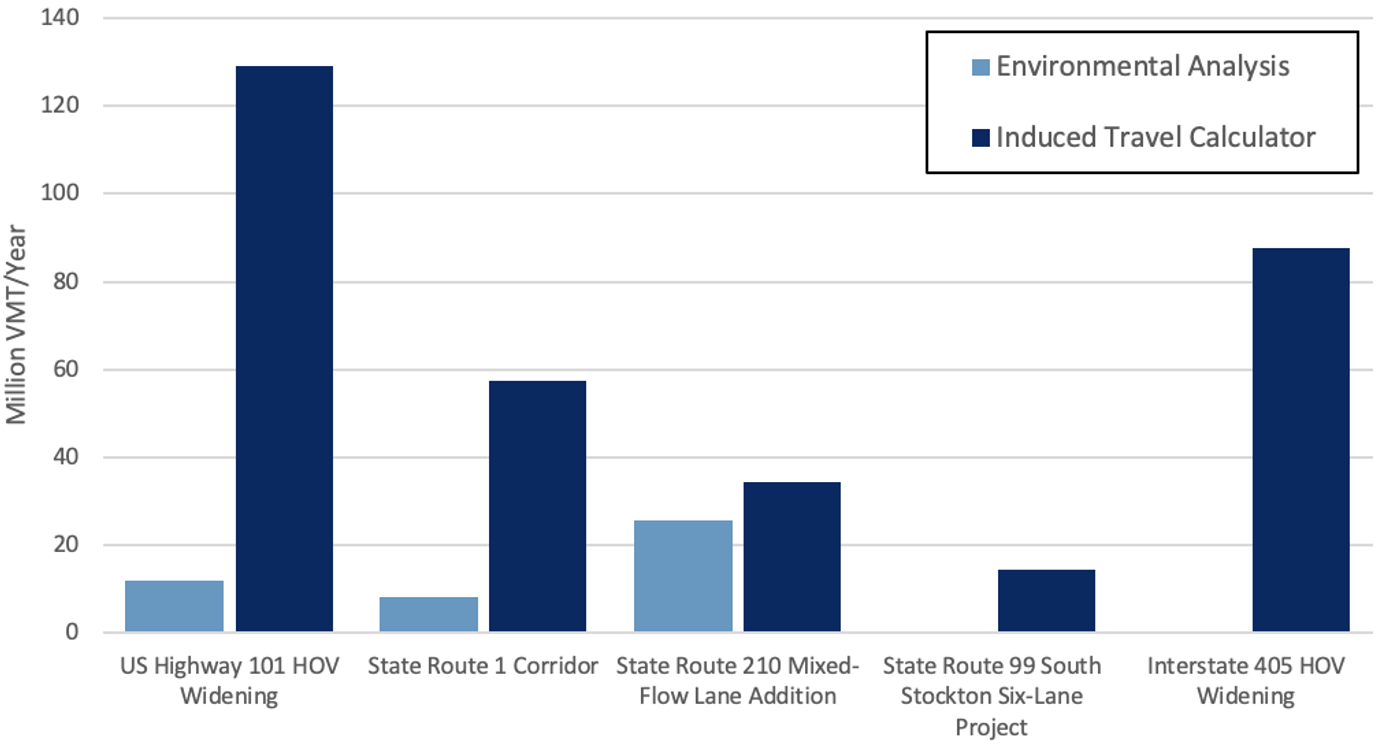
We applied our calculator to five highway expansion projects approved in California over the last 12 years. The agency overseeing each project completed an environmental review, as required by federal and state law, to help decision-makers and the public weigh the project’s potential costs and benefits. We found that only three of these environmental reviews estimated induced travel effects. All three estimates were lower—two were more than 10 times lower—than our estimates from the Induced Travel Calculator.


Figure 2. A comparison of induced vehicle miles traveled as estimated in highway expansion projects’ environmental analyses (if done) vs. the induced travel calculator.

Figure 2. A comparison of induced vehicle miles traveled as estimated in highway expansion projects’ environmental analyses (if done) vs. the induced travel calculator.

These projects, all of which were proposed with a goal of reducing traffic congestion, appear to have over-promised their congestion relief benefits while not fully disclosing the added traffic, local air pollution, and greenhouse gas emissions they will cause.

The role of policy

Caltrans has recently taken a significant step toward accounting for the effects of induced travel. For the first time, it issued guidance on measuring induced travel and recommends using our Induced Travel Calculator when applicable. These efforts stem from new state requirements to analyze the impacts of proposed projects on vehicle miles traveled, under the California Environmental Quality Act. While the calculator is tailored to California, it could easily be adapted for use in other states. For example, City Observatory recently adapted the calculator for the Portland, Oregon metropolitan area.

As the new US Department of Transportation leadership contemplates taking up greenhouse gas performance measure regulations previously issued under the Obama administration and rescinded by the Trump administration, it should ensure that states tracking emissions from their highway systems are accurately accounting for the effects of adding highway lanes. A recently introduced bill in Congress would do just that, requiring state and regional governments to publish an analysis of how proposals to increase highway capacity would affect vehicle miles traveled.

Reducing transportation greenhouse gas emissions has been stubbornly difficult. The task is made even harder by highway widening projects, which accommodate more driving. A clear-eyed assessment of these projects’ true impacts is an important first step toward reversing this trend.


More information on the Induced Travel Calculator is available in a 2-page policy brief, 14-page research report, more detailed journal article, and recorded webinar.

Jamey Volker is a Postdoctoral Researcher at the National Center for Sustainable Transportation, led by the UC Davis Institute of Transportation Studies. 

Mike Sintetos is the Policy Director for the National Center for Sustainable Transportation and the University of California Institute of Transportation Studies (UC ITS) Statewide Transportation Research Program at the UC Davis Institute of Transportation Studies.

No, electric vehicles aren’t driven less than gas cars

To design the best electric vehicle policies—affecting their sale, manufacturing, and charging—we need to know whether electric vehicles can function as replacements for gasoline vehicles. Addressing this question is controversial and important. Bringing clarity is critical because some interest groups opposed to electric vehicles state that less usage indicates that electric vehicles are an inferior substitute for gasoline cars, and thus not deserving of government support.

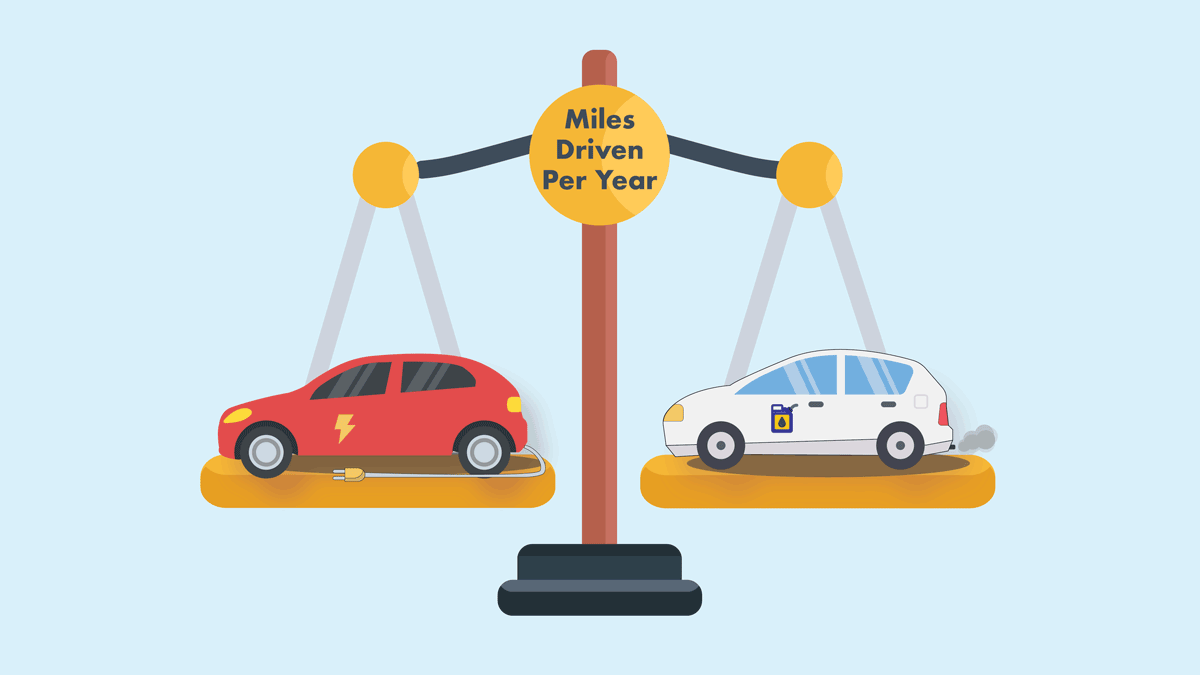
Illustration of EVs balanced on a scale with label "Miles Driven per Year"

Some studies from 2019 and 2021 suggest that electric vehicles are driven much less than gasoline vehicles. Our research and data tell a very different story. We find overwhelming evidence that electric vehicles are driven as much as, if not more than, gasoline vehicles. We focus on battery electric vehicles (EVs), since those are the most hotly debated, though we also present data from plug-in hybrids.

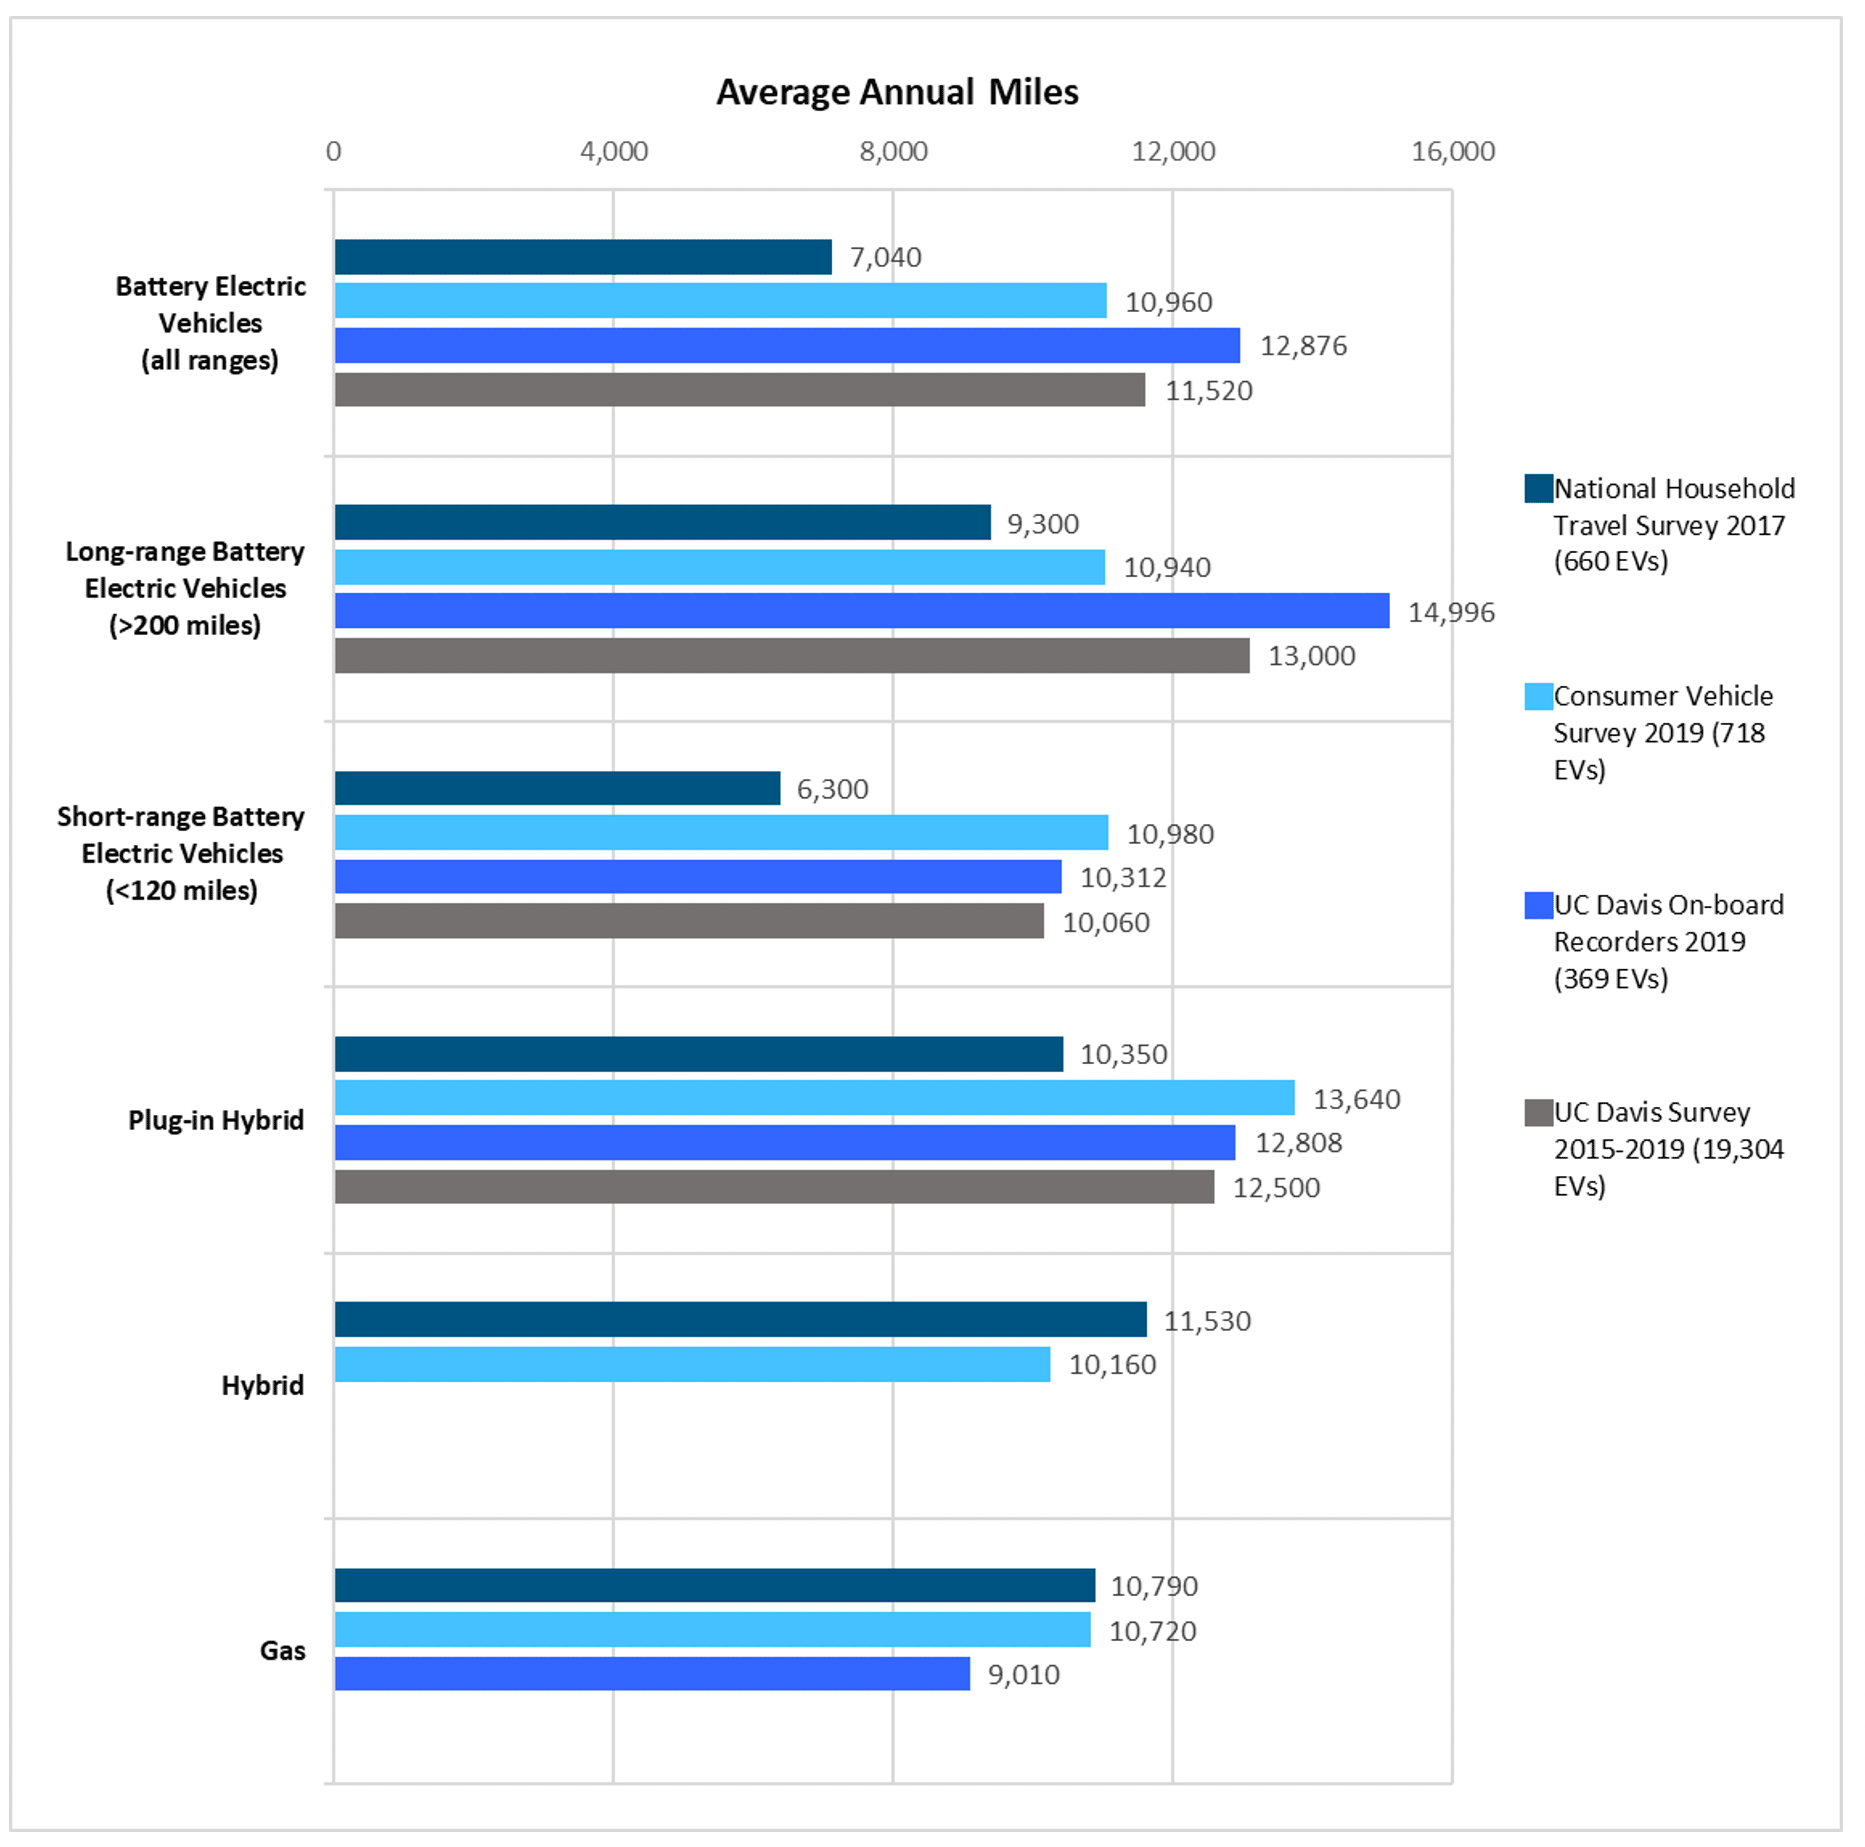
Using multiple sources of data, we find that battery EVs are driven on average about 11,000 to 13,000 miles per year, while gasoline vehicles are driven about 9,000 to 11,000 miles per year. Our estimate of annual EV miles is much higher than previous studies report. There are three explanations: (1) prior studies used data mostly from short range EVs; (2) the range of newer EVs is much greater; and (3) data collection methods in earlier studies had certain biases and limitations.

On the issue of increasing driving range: five years ago, most EVs had a range of around 80 miles. These vehicle models have been largely phased out. Today there are 13 EV models with more than 200 miles of range. These longer-range models tend to be driven more and now dominate the market. In 2020, only 448 EVs with less than 100 miles of range were sold in the United States, compared to 251,333 EVs with more than 200 miles of range.

On the issue of data collection: previous studies were based not only on shorter range vehicles, but, in some cases, they underestimated vehicle miles traveled based on measures of at-home charging, without accurately measuring away-from-home charging or hybrid miles traveled by plug-in hybrid vehicles.

To address the debate on EV use, we analyzed four datasets—from the outdated 2017 National Household Travel Survey (NHTS), the California Energy Commission 2019 Consumer Vehicle Survey, and two UC Davis studies. One of these two UC Davis studies used the most reliable source of electric miles traveled—measurements from data recorders on board vehicles. The second used data from multi-year questionnaire surveys completed by 19,304 EV and plug-in hybrid owning households, a far larger sample with a greater variety of households and vehicles than the samples in other data sets (for information on this survey see here and here). The figure below shows the results from each data set for all EVs (i.e., all ranges), short-range EVs, long-range EVs, plus plug-in hybrids, gasoline hybrid vehicles, and gasoline cars.

Chart showing average annual miles driven by EVs

EVs are driven as much as, or more than, gasoline vehicles. In this chart, the average annual vehicle miles travelled for each vehicle type is shown, with the bars color coded to indicate the source of the data. (Figure adapted from this UC Davis report.)

As the figure shows, the NHTS data (dark blue bar at the top of each set) gives the lowest estimate of miles traveled for EVs of different ranges and plug-in hybrids (top vehicle types in the figure). The NHTS data set is, however, the least current of the data sets shown and the most affected by factors that lead to underestimating electric miles traveled. Namely, it is based on early, short-range models of electric vehicles and early adopter households with older drivers, retirees, and multiple vehicles. All of these differences would lead to lower overall electric vehicle mileage.

In contrast to the NHTS data, the more current data sources, and those more representative of the existing EV market, indicate that even newer short-range EVs (ranges under 120 miles) are driven an average of 10,060-10,980 miles annually; with long-range EVs (range over 200 miles) reaching 10,940-14,996 miles annually; and plug-in hybrids logging 12,500-13,640 miles annually.

Before discounting the benefits of electric vehicles based on how much they are driven, we need to keep in mind the limitations of the different sources of data, as well as the characteristics of the electric vehicle owners surveyed. Large-scale data from automakers’ telematic systems or on-board recorders would be optimal but are not available. For now, data from surveys like the UC Davis survey and data from on-board recorders may offer the best available estimate of how EVs and plug-in hybrids are being used in the real-world.

In summary, all the recent direct sources of data that we investigated indicate that, contrary to some reports, both EVs and plug-in hybrids are driven at least as much as gasoline vehicles. These results and the debates around electric vehicle use highlight the need for research and data collection focused on understanding how electric vehicles integrate into households. This research will become even more relevant as regions, including California, work towards goals of 100% new vehicle sales being electric, and as these regions base their regulations and incentives on how those vehicles are used.

Debapriya Chakraborty, is a postdoctoral researcher with the Plug-In Hybrid and Electric Vehicle Research Center at ITS-Davis

Scott Hardman, Ph.D. is a professional research scientist with the Plug-In Hybrid and Electric Vehicle Research Center at ITS-Davis and manages the International EV Policy Council   

Seth Karten is the Science Writer at ITS-Davis

Gil Tal is the Director of the Plug-in Hybrid and Electric Vehicle Research Center at ITS-Davis

California’s ZEV Rule a Model, This Time for Korea, With Help From ITS-Davis Researchers

Transportation and Climate Blog: California’s ZEV Rule a Model, This Time for Korea, With Help From ITS-Davis Researchers

Here’s a major policy success of 2020 that probably slipped by most people in the United States: Korea, the sixth-largest producer of automobiles and home to the third-largest automotive group in the world (Hyundai-Kia), successfully implemented its own zero emissions vehicle (ZEV) sales regulation—with help from ITS-Davis researchers.

Korea’s ZEV rule is fashioned after California’s ZEV mandate, which is widely credited with the commercialization of ZEVs globally and is one reason California is the leading US state for electric vehicle sales. ITS-Davis researchers have contributed to the evolution of the ZEV regulation since the early 1990s by providing independent analysis of vehicle technologies; environmental and economic impact studies; and consumer behavior research to enhance market understanding.

ITS-Davis’s involvement with Korea’s ZEV rule grew out of a relationship between the UC Davis Plug-in Hybrid & Electric Vehicle (PH&EV) Research Center and the Korea Transport Institute (KOTI), a government think tank responsible for ZEV policy and research. KOTI participates on the International EV Policy Council, a PH&EV Research Center-led program that brings together international scientists, academics, and researchers to build an in-depth understanding of global electric vehicle market developments backed-up by empirical evidence.

In 2018, a team of researchers from the PH&EV Center—including Alan Jenn, Jae Hyun Lee and Scott Hardman—traveled to Seoul to meet with researchers from KOTI to exchange research findings. The ITS team learned that although Korea offered strong financial incentives for ZEVs and had ample charging infrastructure, vehicle supply was lacking. Most of the ZEVs produced in Korea were being exported to markets like Norway and the United States. Few were available domestically.

The Korean government, which until then had not adopted national EV policies, was shaken by severe air pollution episodes in 2018 and 2019 and widespread public demand for cleaner air and eco-friendly car policies. As a result, it appointed KOTI to research and design the Korean ZEV sales regulation.

KOTI tapped the collective expertise of ITS-Davis and the International EV Policy Council. ITS-Davis provided direct and indirect assistance in the drafting of Korea’s ZEV regulation. The EV Policy Council provided international policy expertise to inform Korea’s policy development process. It also facilitated a 2019 workshop in Davis attended by a Korean delegation and representatives from the California Air Resources Board (CARB). The ITS-Davis team and CARB experts provided feedback on a draft of the Korean regulation and suggested changes to increase its effectiveness in meeting its goals of ZEV sales and improved air quality. Their recommendations included increasing the ZEV sales target, adjusting the credit calculating system, and implementing a penalty system for non-compliance. Korean officials incorporated the recommended changes into their regulation and it continued through the regulatory process.

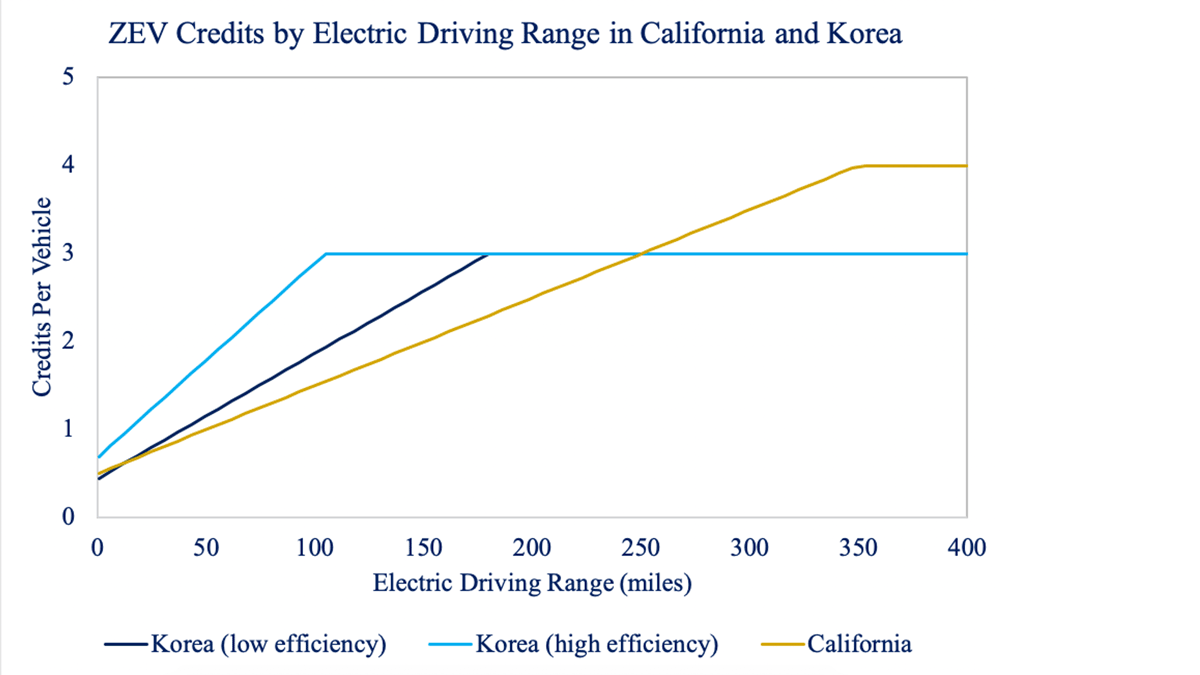
In large part due to the work of KOTI, Korea’s ZEV regulation was introduced and passed in April 2020 as the Clean Air Conservation Act Chapter 4 Article 58-2 “Deployment of low-emission Vehicles”. Korea’s ZEV credit target, like California’s, is 22% of vehicles sold in 2025. The regulations in Korea and California require automakers to annually accrue a minimum number of ZEV credits, which are awarded for each ZEV sold, based on vehicle characteristics such as range. Korea’s per-vehicle credit calculations mirror California’s, though credits are capped at 3 per vehicle rather than 4. (For background on how California’s and other jurisdictions’ ZEV policies work, see this International EV Policy Council brief.) Unlike California’s rule, Korea’s credit calculation accounts for vehicle efficiency in addition to ZEV range (see figure). Also unlike California’s rule, compliance with Korea’s ZEV rule is voluntary at present to allow automakers time to plan their compliance strategies. After 2023, penalties for non-compliance will be introduced.

The regulation does not yet set overly ambitious targets for ZEV sales. However, Korea now has a regulatory framework into which larger ZEV sales targets, including 100% ZEV sales, can be introduced. Furthermore, the regulation signals Korea’s desire to support a transition to ZEVs to improve urban air quality and reduce greenhouse gas emissions.

As more nations consider ways to transition to 100% electric vehicle sales, a ZEV requirement may provide a regulatory route for reaching these targets. A ZEV regulation can create certainty for automakers by providing a clear pathway of ZEV sales that ramps up from single digit percentages to 100% of the market.

ZEV Credits by Electric Driving Range in California and Korea

Low efficiency Korea calculation assumes battery electric vehicle (BEV) efficiency of 5.3 km/kWh (Kia Niro BEV). High efficiency Korea calculation assumes 8.2 km/kWh (Hyundai Ioniq BEV). Electric driving range assumes EPA ranges for California and WLTP ranges for Korea (converted to miles from kilometers).

Acknowledgements

The authors acknowledge ClimateWorks Foundation and the Paul G. Allen Family Foundation for funding the work of the International EV Policy Council.


Scott Hardman, Ph.D. is a professional research scientist at the Institute of Transportation Studies, University of California, Davis and manages the International EV Policy Council 

Jiyoung Park, Ph.D. is a senior researcher at The Korea Transport Institute (KOTI) and a member of the International EV Policy Council

Keeping e-Commerce Environmentally Friendly—What Consumers Can Do

Illustration of vehicles in traffic heading into city


With more states and individuals observing stricter limits on in-person shopping, and with holidays coming, what can we do to limit the environmental and societal impact of online shopping? And even beyond this moment, how do we minimize the harm—or maximize the benefit—of online shopping to society and life on our planet?

The short answer: Buy what we need, and do what we can to allow packages to be consolidated for the most efficient delivery routes, so the fewest miles possible are traveled for each package brought to the door.

Theoretically, e-commerce—the buying and selling of goods and services using the internet—should be an environmentally friendly alternative to shopping in a store. A full delivery van driving an optimized route to deliver 50 packages contributes far less pollution and traffic congestion than 50 people driving their personal cars to the store and back. However, consumers tend to buy one item at a time when shopping online but bundle several items on a shopping trip. Plus, online shopping becomes less environmentally friendly as retailers offer perks such as free returns and expedited shipping, to attract shoppers and gain market share.

Our research examines how different types of e-commerce transactions affect local air pollutant emissions, carbon dioxide emissions, and vehicle miles traveled—as well as traffic congestion.

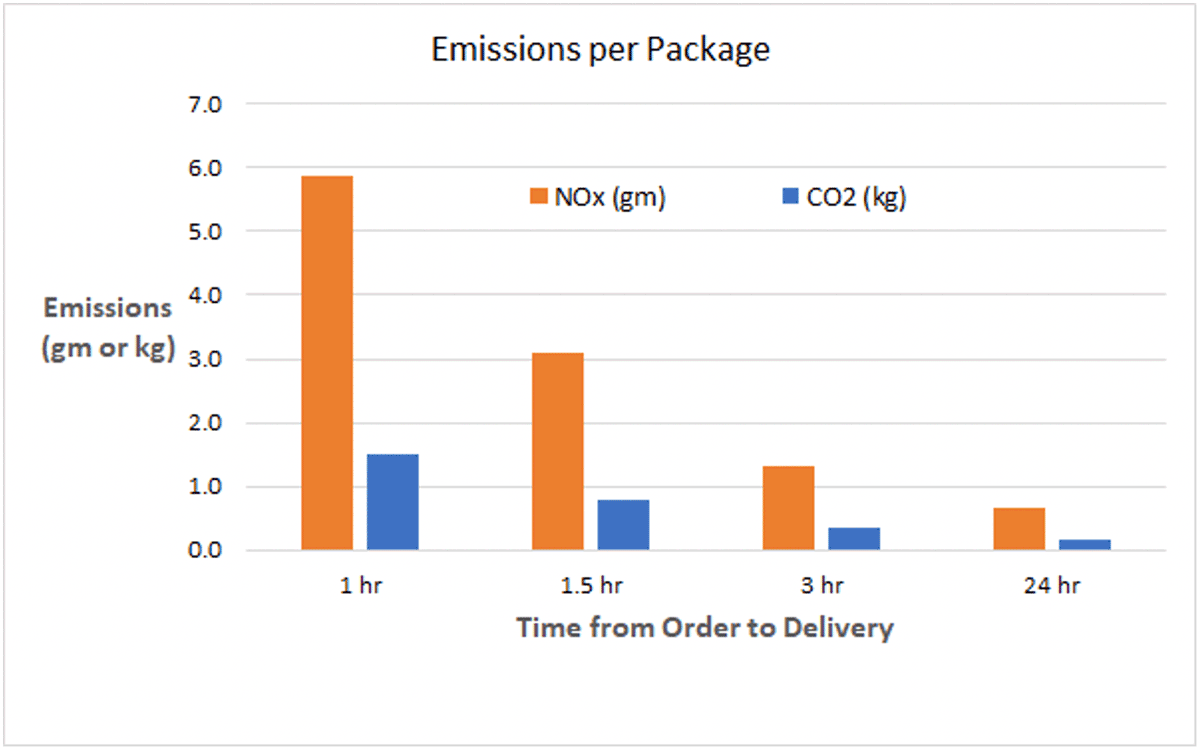
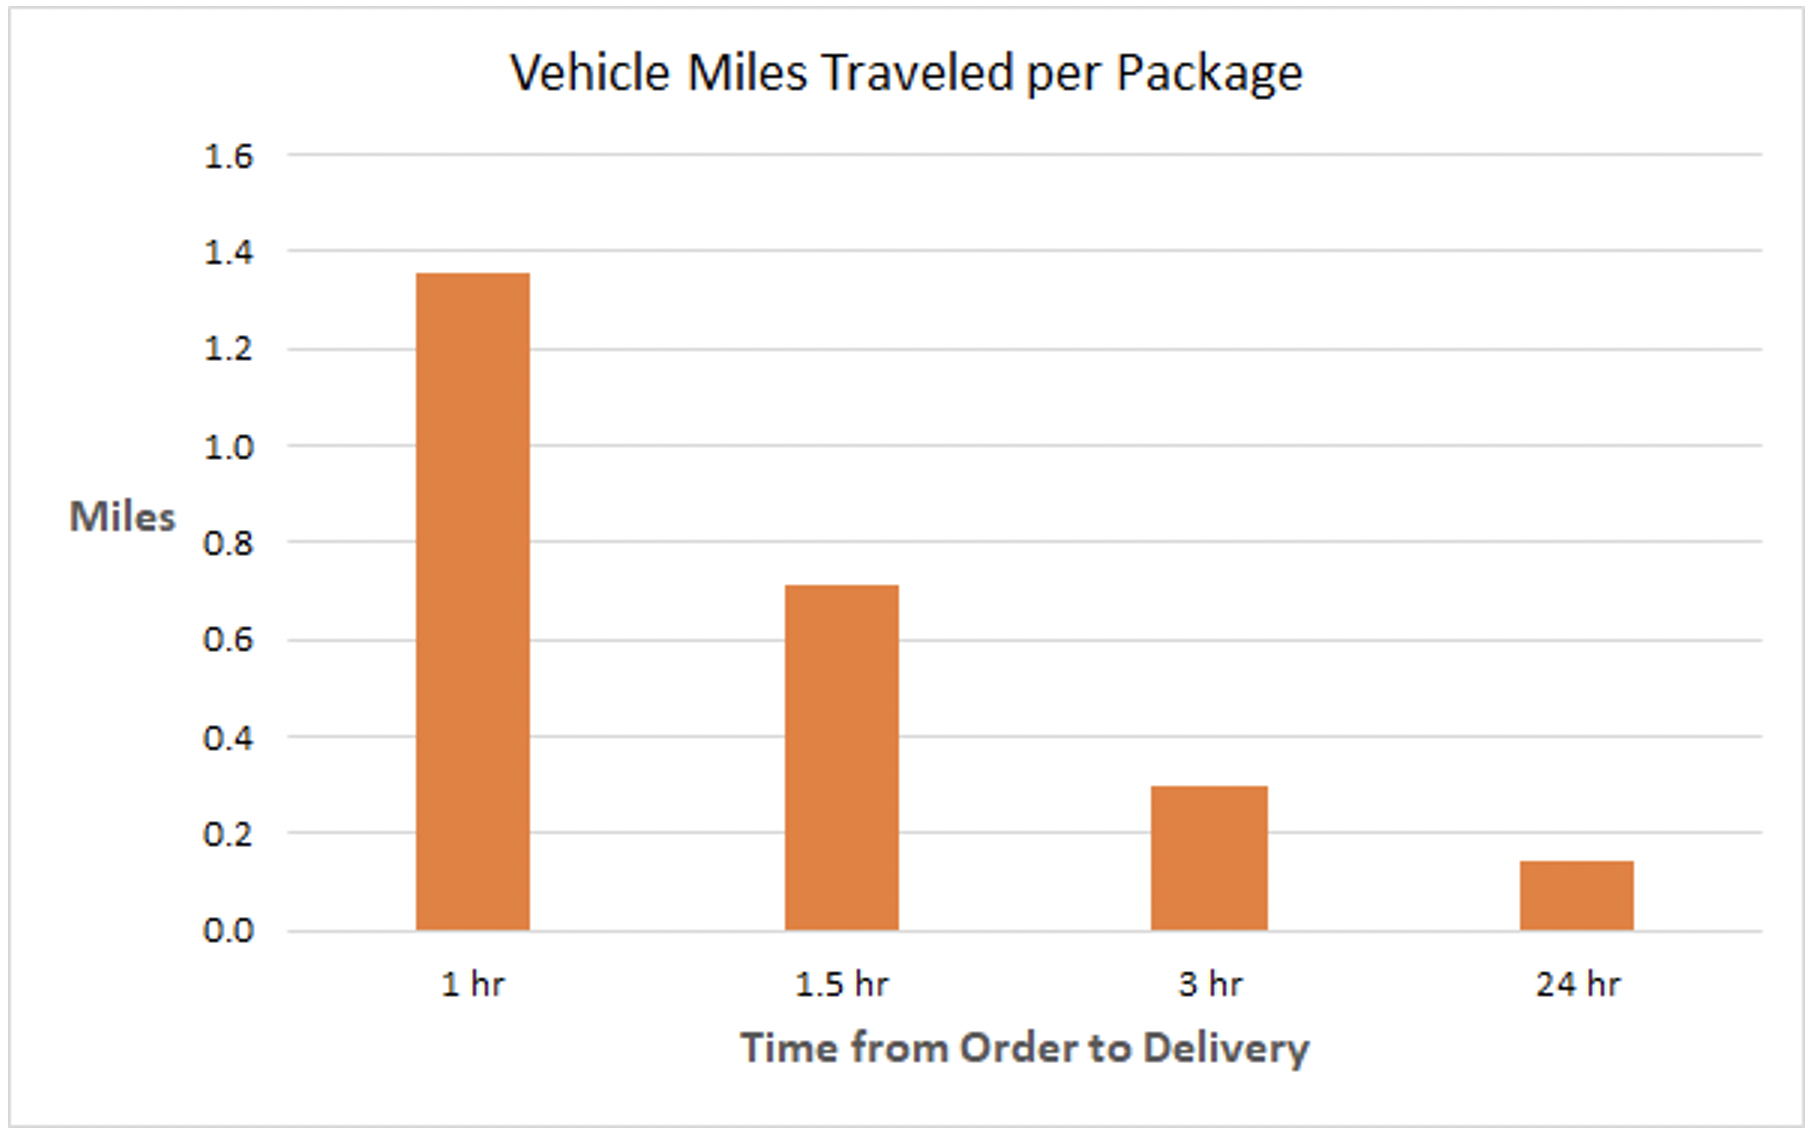
We found that expedited delivery times were among the most important determinants in worsening emissions and increasing the number of vehicle miles traveled. As delivery times get shorter (e.g., 2-days to 1-day to 1-hour), the environmental and societal costs dramatically increase, as the figures here show.

Chart showing emissions per package

Chart showing vehicle miles traveled per package

Figure: As the time from order to delivery lengthens, the emissions (top) and vehicle miles traveled (bottom) for each package decrease. (NOx, nitrogen oxides; CO2, carbon dioxide)

To meet shorter delivery times, delivery vehicles operate at reduced capacity (i.e.,  depart before they can be completely filled). We calculated that a vehicle with a one-day time window can make 120-300 deliveries, while a vehicle constrained by a one-hour time window can only make about 10-15 deliveries, depending on the characteristics of the geographic location.

So what does this mean for us as consumers? Factors that increase the number of items per vehicle mile of travel in a delivery or shopping trip will reduce the pollution and traffic impacts of our purchases. We should consider the following actions, when possible, to reduce the environmental impact of our online purchases:

  1. Allow longer time windows for delivery whenever possible, even if we do not save out-of-pocket expenses for it.
  2. Group orders together as much as possible by pooling orders into a single delivery and do not impose additional constraints on the delivery, such as specific days and times.
  3. Minimize returns and consider buying clothing, shoes, and electronics in-person, as these have high rates of return from online shopping (clothing/shoes 56%, electronics 42%).
  4. Avoid driving to the store to decide on—but not purchase—an item, and then ordering it online to save money, thereby increasing the miles traveled for one purchase.
  5. For recurring purchases, take advantage of subscriptions, which can save money and allow the vendor to optimize planning and delivery.
  6. Select, when possible, an alternative delivery location (e.g., pickup facility, lockers) at a place that you are already going to travel to, preferably by walking or biking.

Besides consumers, governments, including local planning and permitting agencies, and other businesses, including e-commerce and delivery companies, affect how e-commerce impacts society, the environment, and climate. In an earlier blog post, we considered the impact of these many government and business entities on the shifting locations of warehouses and distribution centers, and the resulting impact on  pollution and congestion in disadvantaged communities. In future blogs we will consider other ways agencies and companies can help reduce emissions and vehicle miles traveled.

For more information, please see our journal article comparing e-commerce to in-store shopping and our in-depth report on the research tools and findings regarding determinants of e-commerce externalities.

Miguel Jaller is Co-Director of the Sustainable Freight Research Center at ITS-Davis. He studies freight transportation, sustainable transportation systems, and humanitarian logistics.

Anmol Pahwa is a Ph.D. candidate in the Civil and Environmental Engineering Department at UC Davis. His blog is at https://the-world-of-transportation-science.blog/.

Seth Karten is the Science Writer at ITS-Davis.

A National Zero Carbon Transportation Plan for the US

Cyclists on bike path approaching an intersection

America's Zero Carbon Action Plan

Is net zero-carbon energy really attainable for the entire US? If so, when? A major new study of deep decarbonization of the US economy, entitled the Zero Carbon Action Plan, was published October 27. It was conducted by senior academics and other thought leaders, working under the auspices of the Sustainable Development Solutions Network, an initiative of the United Nations. The authors developed scenarios for achieving net-zero emissions by 2050, analyzed different strategies, and recommended policies and investment actions. We served as the lead authors of the transportation section of the Plan and presented a webinar with our coauthors on that section, on October 29.

Is net-zero carbon possible for transportation? Our answer is a qualified yes: achieving close to net-zero carbon emissions is possible by 2050, but it will require extraordinary focus and commitment. The No. 1 strategy for transportation, dwarfing all others, is definitive: electrify nearly all cars, trucks, and buses while transitioning the electricity sector to zero-emission energy. All other strategies pale in comparison.

Electrifying light duty vehicles—cars, pickups, and SUVS—means having them be battery electric vehicles, plug-in hybrid vehicles, or fuel-cell electric vehicles. Battery electric vehicles run exclusively on rechargeable batteries; plug-in hybrid vehicles add to this a small internal combustion engine that is gasoline powered and supplements the battery power; and fuel cell electric vehicles run on liquid hydrogen that is converted to electricity on board. We consider all of these to be “electric” and are not taking a position on what share each of these technologies should have, other than they must add to 100% of vehicle sales by 2040 to achieve the carbon target.

To achieve deep decarbonization, most larger trucks, from delivery vans to trash trucks and large tractor trailers, would also be electrified, with the energy coming primarily from batteries or hydrogen. Some long-haul trucks would likely use low-carbon biofuels or electricity-derived liquid fuels, as well as hydrogen. Achieving net-zero carbon emissions will require the use of renewable energy to produce electricity and hydrogen and a transition to lower-carbon and more sustainable biofuels.
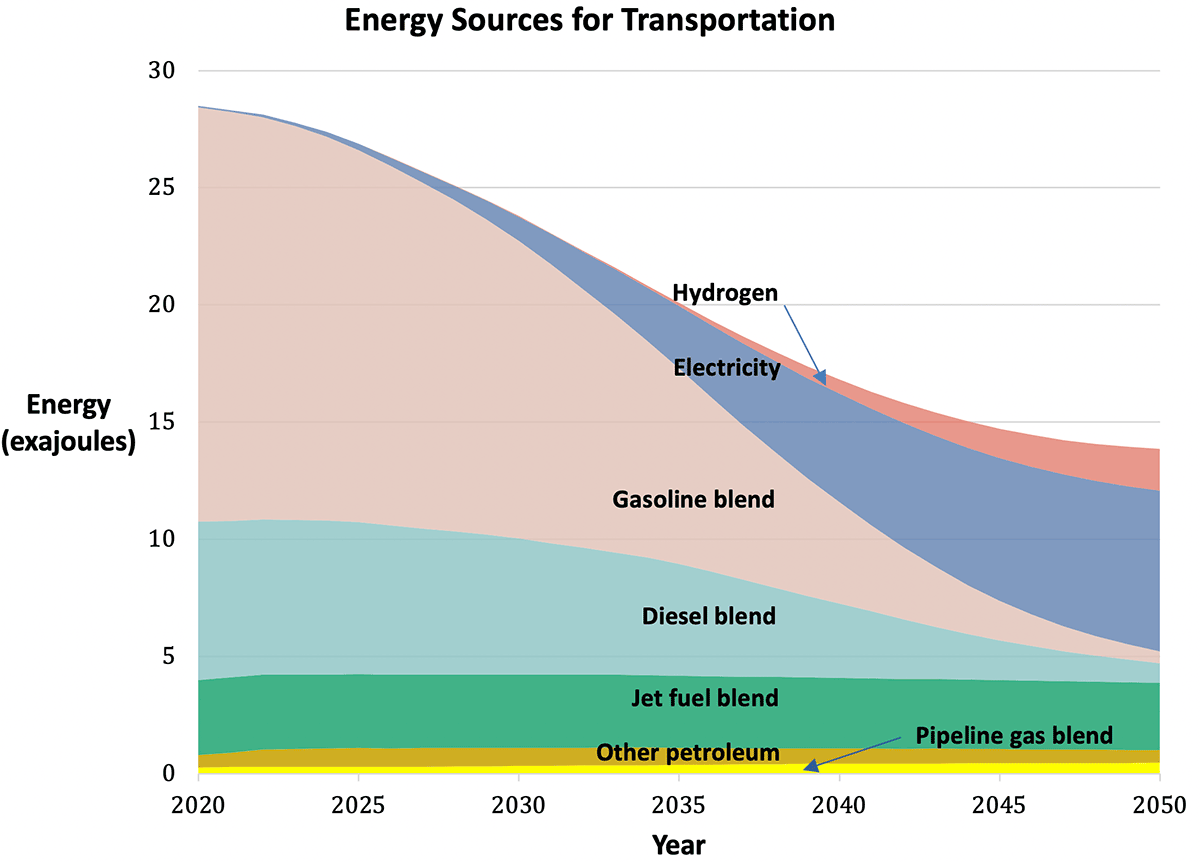
Graph of Energy Sources for Transportation

Changes in the sources of energy for transportation that would achieve a nearly 100% reduction in domestic transportation greenhouse gas emissions by 2050. Note, the energy source that most increases is electricity and most decreases is gasoline blend. Blends would have increasing shares of low-carbon biofuels or electrofuels (from Zero Carbon Action Plan).

Another important strategy is reducing vehicle use by providing greater access to alternative modes of transportation, including transit and active modes such as biking and walking. In addition to the greenhouse gas reduction benefits, reductions in vehicle use would generate massive co-benefits: less space and cost for roads and parking, less wasted time in traffic, fewer traffic fatalities, more livable communities, and improved public health. However, these co-benefits are only realized if we devise other means of providing mobility and accessibility to jobs, health care, school, and more, especially for those who are mobility disadvantaged, whether for reasons of physical or economic limitations. Thus, this vehicle use strategy must be accompanied by investments and policy to support walking and biking, transit, and demand-responsive ride-hailing—with a focus on providing more mobility at less cost. The strategy of reducing vehicle use is compelling because of the large co-benefits, but the challenge of changing behavior is daunting. Based on research by ourselves and others, we settled on a goal of 25% reduction in vehicle use by 2050, acknowledging that electrification of vehicles will achieve far greater greenhouse gas reductions by then.
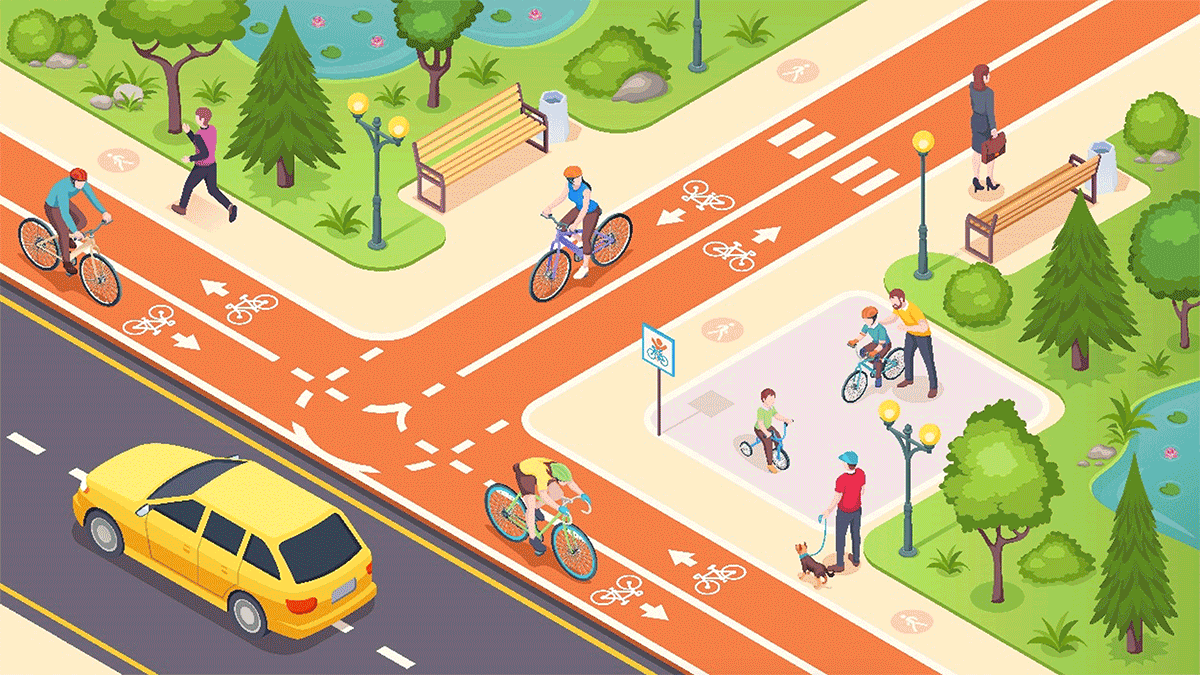
Cyclists on bike path approaching an intersection

Infrastructure to increase active modes of transportation.

Other strategies are also important, including for planes and ships, which account for just over 10% of transport-related greenhouse gas emissions. A different set of investments and policies are needed, such as supporting research and investment in low-carbon fuels and new vehicle technologies like electric airplanes and ferries, and shifting to rail and other less-carbon intensive options.

All of this is possible within the coming decades. Indeed, virtually all analyses indicate that this transition is good not only for the environment, but also for the economy. Costs are declining so fast and so far for batteries and renewable energy, that if we scale up quickly, the total cost of owning and operating most cars, trucks, and buses—all but the large trucks used for long distance freight shipments—will be cost competitive with gasoline and diesel vehicles by about 2030 and in some applications, much sooner. And soon after that, the net effect will be savings relative to gasoline and diesel cars and trucks. In other words, we will be coming out ahead economically with battery and hydrogen vehicles within 10-15 years!

While the economics of this transition are compelling, it doesn’t mean it will be easy. Survey research finds that consumers remain uninformed about electric and fuel cell vehicles, and that they don’t make vehicle purchase decisions based on an analysis of the “total cost of ownership” over the vehicle lifetime. Even when they do, they tend to underestimate how long they would keep the vehicle, what the future revenues from selling their vehicle into the second-hand market will be, what the future price of fuels will be, and much more. Moreover, cost comparisons of electric vs. gasoline and diesel vehicles do not address other consumer concerns, including those associated with “range anxiety.” Those living in apartment buildings may be apprehensive about where to charge, unless provisions are made for public charging to overcome their concerns. And those who travel regularly to rural areas will likely be frustrated by limited fueling opportunities. Others will experience unfavorable economics if they do not drive much, since the lower energy and maintenance costs of electric vehicles would be swamped by the higher vehicle purchase price.

Therefore, incentives will be needed to encourage the transition. But the cost of these incentives need not fall on taxpayers. Various policies are possible, already in existence in the US and Europe, to shift the costs to buyers of internal combustion engine vehicles and suppliers of fossil energy. For example, the low carbon fuel standards in Oregon and California set a carbon intensity performance standard for fuel suppliers. Those that cannot or won’t sell low-carbon fuels, buy credits from those that do. These credits translate into incentives to electric vehicle users, paying for nearly the entire cost of the electricity in the case of truck fleets, or consumer rebates of about $1500 for electric vehicle buyers.

Likewise, “feebates” in France and other European countries charge a fee for buying gas guzzlers that is used to fund rebates of up to $10,000 to buyers of electric vehicles—for trucks as well as cars. This policy could be adopted in the US. Along with the low carbon fuel standard, these policies would generate more than enough incentive funding to convince most consumers to buy electric cars and trucks—with no cost to taxpayers.

Just as some of the largest benefits from reducing vehicle use go well beyond climate change mitigation, likewise switching to electric vehicles—including school and transit buses—results in significant air quality and public health benefits, especially in communities of color and low-income communities overburdened by pollution.

In summary, the transition to a low-carbon future is already underway and can be expedited with minimal costs to taxpayers and large benefits to consumers, the economy, and public health. It won’t be easy, and some changes will be disruptive, but these changes are necessary to achieve climate and other goals. This transition will require a variety of actions by federal, state, and local governments as spelled out in detail in the Zero Carbon Action Plan report, with policy recommendations summarized briefly below.

Summary of Policy Recommendations

  • Rapidly increase the sales of zero emission vehicles (ZEVs) by implementing the following:
    • National ZEV sales requirements for cars
    • National ZEV sales and fleet purchase requirements for trucks
    • Incentives for ZEV vehicle purchases and ZEV infrastructure
  • Tighten fuel economy/GHG standards for all new cars and trucks
  • Adopt national low-carbon fuel standard covering all fuels for road vehicles and airplanes
  • Reduce dependence on automobile travel while increasing access for walking, bicycling, new micro mobility modes, telecommunications, transit, pooled ride-hailing services, and other low carbon choices, especially for disadvantaged travelers, by:
    • Shifting federal transportation or stimulus funding from new highway capacity and lane expansions to: bicycle and pedestrian infrastructure and new micro mobility modes; transit in dense areas; and public-private partnerships between transit operators and ride-hailing providers.
    • Supporting local and state actions that increase low-carbon travel and investments, reduce single-occupant vehicle use, and increase transit-oriented development.
    • Reforming fuel taxes and other vehicle-related fees and adopting pricing policies to favor the use of more sustainable travel options and generate funding for low-carbon vehicle and travel choices.
  • Support low-carbon biofuels and electrofuels for aviation, ships, and long haul trucks.
  • Support local policies that increase the use of automation for electric, pooled vehicles to reduce vehicle use, provide low-cost accessibility to mobility-disadvantaged travelers, reduce the cost of travel to individuals and society, and sharply reduce the amount of land devoted to transportation.

Daniel Sperling is Founding Director of the UC Davis Institute of Transportation Studies, and distinguished Blue Planet Prize Professor of Engineering and Environmental Policy. He also serves on the California Air Resources Board, overseeing policies and regulations on climate change, low carbon fuels and vehicles, and sustainable cities.

Lew Fulton is Director of the Sustainable Freight Research Center and the Energy Futures Research Program at the UC Davis Institute of Transportation Studies. He helps lead a range of research activities around new vehicle technologies and new fuels, and how these can gain rapid acceptance in the market.

Vicki Arroyo is Executive Director of the Georgetown Climate Center based at Georgetown University Law Center, where she is also a Professor from Practice. Professor Arroyo oversees the Georgetown Climate Center’s work at the nexus of climate and energy policy. She is also a member of the faculty steering committee for the Georgetown Environment Initiative, a cross-campus effort to advance the interdisciplinary study of the environment in relation to society, scientific understanding, and sound policy.

Finding a Path to 100% Zero Emission Vehicle Sales by 2035 in California

California license plate ALL EV 2035

California recently announced plans to electrify nearly all new cars and trucks by 2035. Is this possible? If so, how?

Governor Gavin Newsom signed Executive Order N-79-20 on September 23, directing the California Air Resources Board (CARB) to develop regulations to require that all new passenger cars and light-duty trucks sold in the state be zero emission vehicles (ZEVs) by 2035, all drayage trucks (at ports) be ZEVs by 2035, and all medium- and heavy-duty trucks be ZEVs by 2045 (not just sales) “everywhere feasible.”

As the past few decades have shown, the road to a ZEV future won’t be an easy one. How, then, can we realize these ambitious goals? Research from ITS shows that new policies and new behaviors are needed to achieve these targets.

First, for the market to expand beyond early adopters, more incentives, rather than fewer, will be needed. We expect this pattern to continue until up-front prices for electric vehicles achieve parity with conventional vehicles—which will be many years in the future. If one considers the lower energy and maintenance costs of electric vehicles, the total cost of ownership will start to reach parity in just a few years. But consumers do not generally take the total cost of ownership into account in making purchase decisions.

Second, research from Ken Kurani shows that even though electric vehicles have been available to Californians since before 2014, most mainstream consumers have not shown much interest in them. Instead, a select group of consumers who are predisposed to buying electric vehicles are responsible for most of the sales so far. To sell electric vehicles to the mass market this must change.

Third, the electric vehicle market has been dominated by high-income consumers. These households have purchased around 50% of electric vehicles, despite accounting for only about 4% of all California households. To continue growing the market, many of the other 96% of the population will need to begin purchasing ZEVs.

It is clear we must address these issues of increasing reliance on incentives, lack of consumer engagement, and lack of electric vehicle sales to the vast majority of Californians.

While research shows incentives are becoming more important for consumers, many of those incentives are being reduced or phased out. The incentive for battery electric vehicles from the California Clean Vehicle Rebate Program recently fell from $2,500 to $2,000. The federal tax credit for ZEVs phases out after each automaker sells 200,000 ZEVs nationwide; several automakers have surpassed that number. To continue to grow electric vehicle sales, incentives will need to persist. Current incentive designs are a strain on budgets, so federal and state governments are unlikely to continue funding them. One solution that has been deployed in Sweden and France is a feebate. It imposes no burdens on taxpayers. This is where an adjustable purchase fee on the highest-emitting gasoline vehicles funds consumer rebates on ZEVs. Another key to growing the ZEV market will be incentives that diminish the cost of using ZEVS, like discounts on parking, tolls, and electricity. Even when ZEVs reach (average) price parity with conventional vehicles, incentives will still be needed for those cases where EVs are especially costly or inconvenient, for instance in rural areas, for apartment dwellers, and for larger vehicles that need extra-large batteries. Moreover, many consumers are likely to be resistant for a variety of reasons, such as those related to their circumstances or politics.

Methods to increase consumer awareness might include: increased exposure to ZEVs through electrification of ride-hailing and car-sharing fleets; public education programs like that by Veloz or through trusted community-based organizations; and education and motivation programs for car dealers. There are the crucial and so-far missing considerations of vehicle availability and advertising. Automakers are slowly introducing more models—some committing to electrifying their whole production lines—but consumer options remain limited and ZEVs are not widely available throughout the state and certainly not throughout the country. Automakers will have to begin shifting more of their marketing budgets to support ZEVs and away from the lower-risk (and higher profit margin) gasoline-car market, in response to either regulations or internal plans to increase ZEV production.

To broaden the ZEV market, especially to include consumers who can’t install a home charger, we will need to consider how to develop a charging network that is convenient and easy to access. Determining where to add these chargers will be an ongoing challenge, but studies of current electric vehicle drivers’ charging choices offer helpful insights. For example, most charging occurs at home from 6 pm to midnight, so making charging more available for renters and at multi-family dwellings and low-income housing areas will be key. Evidence also shows that charger availability and pricing can influence when and where people charge. We should expand publicly accessible charging sites that people can use while they are at work during the day—as daytime charging optimizes abundant and clean solar power. Ideally, these same chargers could be accessible to nearby residents who can only charge at night.

With this executive order, California continues to lead the charge in the U.S. to transitioning to a 100% ZEV future. Yet, this monumental societal shift must be guided by sensible local, regional, and state policies and programs, based on research and global experience. There are ample challenges to overcome. Industry and the public must be engaged at all levels of the process to address these three big needs—for ongoing incentives, increasing consumer awareness, and charging infrastructure. Only by working together to create the supply needed from the industry and the demand from the market can we ensure that future ZEVs meet society’s transportation needs while achieving our ambitious climate goals.

Seth Karten is the Science Writer at ITS-Davis.  

Austin Brown is the Executive Director of the Policy Institute for Energy, Environment, and the Economy at UC Davis

Gil Tal is the Director of the Plug-in Hybrid and Electric Vehicle Research Center at ITS-Davis 

Scott Hardman is a researcher at the Plug-in Hybrid and Electric Vehicle Research Center at ITS-Davis

E-Bikes are Taking Off, but Public Policy Must Keep Pace

Illustration of cycling in the city

It’s not just the wind at their back. That bicyclist you saw with a comfortable cadence flying down the road is a part of a new transport trend that’s good for rider health and the environment—the electric assisted bicycle, or e-bike. However, barriers and inequities in e-biking signal a need for new policies to promote bicycling in US cities and make bicycling safe and accessible for all people.

Much has been written in recent months about the increase in bicycle sales due to COVID-19. My colleague, Susan Handy, recently commented on this topic in A COVID Boost for Bicycling. It turns out that US e-bike sales have experienced impressive growth, both before and since the pandemic began, with June 2020 reporting a 190% sales increase over June 2019.

This growth is a good sign for the sustainability of transportation because e-bike use tends to increase bicycling frequency, resulting in greater physical activity (even if intensity is lessened by the electric assist). It also tends to reduce driving and could greatly reduce greenhouse gases if adopted widely.

One of the greatest benefits of e-bikes over conventional bikes is the added distance a bicyclist can ride in a given time. This benefit is greatest in areas where the distances between places of interest are relatively short but perhaps perceived as too long or too arduous for conventional bicycling. And this leads to an important additional aspect of e-bike growth: e-bikes now come in different shapes and sizes, from light folding bikes suitable for commuters to heavier-duty cargo bikes designed for parents to transport groceries and children, or for delivery companies to carry goods.

Here at UC Davis, our early research on e-bicycling pointed to some specific barriers for e-bikes such as fear of theft, perception of cheating, and increased cost. Some of these barriers seem to be decreasing, but many others remain. E-bikes tend to share one of the strongest barriers to conventional bicycling, the lack of safeand comfortable environments to ride in. We found that road environments affect the psychological stress of bicyclists and perceptions of comfort for current and prospective bicyclists. Furthermore, research by our group and others shows that bike lanes and paths that are protected and separated from car traffic are much preferred by current and prospective bicyclists and provide important safety benefits. This evidence indicates that refocusing selected streets away from cars and towards bicycles could help normalize this sustainable travel mode.

In light of policing inequities and the recent experimentation in US cities with open streets to support walking and bicycling during the pandemic, many questions remain as to how to successfully and equitably implement changes that encourage more bicycling. Infrastructure planning that fails to engage with and benefit marginalized communities will continue to make the bicycle a “symbol of gentrification and displacement” instead of a “path to freedom” for those most in need. As highlighted in our last blog by Jesus Barajas, inequities and racism in land use development and the policing of public space, along with specific policies that target low-income, black, and immigrant bicyclists keep safe biking and e-biking unavailable to many. Guidance and recommendations for bike planning and policy by my colleague Sarah McCullough and coauthors demonstrate many additional steps that are needed to make bicycling equitable.

Another equity concern specific to e-bikes is their high cost, which prohibits their adoption by low-income households, who may have the most to gain from this new vehicle. This year, one California bill (AB-2667) attempted to put e-bikes on the Clean Vehicle Rebate Program, giving e-bikes a more equal footing with electric cars. Although this particular bill was unsuccessful, policies in Europe to reduce e-bike costs are widespread and growing, giving policy makers in the US a suite of strategies to try.

Increasing people’s exposure to e-bikes is another key to getting more of them on the road. Our ongoing research suggests that people who have had a chance to ride an e-bike are more likely to consider using one as a primary commuting vehicle. One way to expose more people to e-bikes is through sharing programs. With Lime’s acquisition of Jump bikes and the general shift from dockless bikes to dockless scooters in the micromobility service industry, cities may need to play a more active role in providing e-bike share or leasing services. Indeed, many city-owned docked bike shares in places like Portland, Toronto, and Chattanooga are now transitioning to e-bikes. These places will offer a great natural experiment on the general influence of shared e-bikes on e-bike buying and use.

With the COVID pandemic likely to last many more months, the time is right for targeted and equitable investment in e-bicycling as a physically-distanced and sustainable mode of travel that should be safe and available to all. The current growth in demand for e-bikes should be seen to reflect a public enthusiasm for more bicycling-friendly infrastructure, policies, and services in US cities.

Dillon Fitch is Co-Director of the BicyclingPlus Research Collaborative at ITS-Davis. He studies travel behavior and transportation planning and develops tools to improve planning for bicyclesand emerging small vehicles.

‘Bicycling While Black’: The Problems of Policing and Planning

Illustration of cyclists on road

Last week, community members took to the streets yet again to protest two fatal shootings of Black people at the hands of the police, one of which occurred right here in California. On August 31, 2020, Los Angeles County sheriff’s deputies shot and killed Dijon Kizzee in South Los Angeles. The details of the incident are still emerging as of this writing, but the encounter began as deputies tried to stop Kizzee for an unspecified vehicle code violation as he was riding his bike.

Traffic stops are the most common form of interaction between the police and the public. Cases of “driving while Black,” in which Black drivers are disproportionately stopped, are well documented. But the evidence points to cases of “bicycling while Black” too. In New York City, Black and Latino cyclists were given 86 percent of the tickets for riding on the sidewalk in 2018 and 2019, but made up just about half of all cyclists. Those data follow a 2014 report that showed 12 of the top 15 NYC neighborhoods for bicycle tickets were in majority Black or Latino neighborhoods. In Tampa, Fla., eight out of every ten bicycle tickets were issued to Black cyclists between 2012 and 2015. And in Chicago, a city where I have done work recently, bicycle tickets have been issued twice as often in majority Black neighborhoods compared to majority Latino or white neighborhoods since 2008.

The Chicago case offers further insights about how planning intersects with policing. I have done some preliminary analysis examining whether infrastructure availability plays a role in the patterns of bicycle tickets issued in the city, on top of the racial disparities others have identified. About 90 percent of all bicycle tickets issued in Chicago are for riding on the sidewalk. I found that these tickets are more likely to be issued along streets with higher traffic volumes that lack bike infrastructure. Both traffic volume and the overall absence of bike infrastructure tend to be correlated with neighborhoods where there are higher shares of people of color. This tells us that deliberate attention to racial justice principles in bicycle infrastructure design and implementation could prevent other needless deaths.

Each day, bicycling is celebrated as an economically and environmentally sustainable means of transportation, and as a way to stay fit and healthy—even more so during the COVID-19 pandemic. Anyone can do it, bicycle planners and enthusiasts argue, especially if there is high quality, safe infrastructure and nearby places to get to with convenient and secure places to park. But this hopeful vision is not always realized, as prominent Black scholars, transportation practitioners, and advocates have vociferously called out of late because of the recent killings. They point out that Black bodies in public space—no matter the mode of transportation—are always at risk and will continue to be until we address the root causes of that risk. In so many cases, that comes down to racist policing practices. And further still, transportation planning is complicit in those disparities and inequities.

These issues call for a careful review of not only unjust policing practices but also the racist effects of transportation planning, whether or not they are intentional. Vision Zero, the traffic safety strategy designed to eliminate preventable traffic deaths, offers an example of how to move in the right direction. The strategy is rooted in a framework that says crashes can be reduced through better engineering, education, and enforcement. But even these strategies need to be reviewed and modified as new information becomes available. In light of renewed calls for racial justice this summer, the Vision Zero Network is stepping away from highlighting traffic enforcement as a pillar of safety, replacing it instead with guidance for anti-racist policies and processes. Advocates have been sounding this message for some time, and in some places those with the power to make policy changes are starting to come around.

These issues also call for scholars to revisit what it means to research and teach about bicycles. The emerging field of mobility justice urges us to think about how identity plays a central role in how people move around, and how marginalized groups are often denied the freedom of movement that others enjoy. Incorporating a mobility justice lens in research could push scholars to examine whether their work considers these intersections of transportation and identity, and if it doesn’t, then why not. In order to encourage other transportation researchers to engage with these weighty issues in the classroom, my colleagues and I have created a constantly-updated reading list as a resource that faculty can use to address and amplify questions of equity and justice in their teaching. The list highlights Black, Indigenous, or People of Color authors who have been giving voice to these issues for quite some time.

Although important and necessary, examining and changing transportation research practices within academia won’t be sufficient to prevent more deaths of Black cyclists. It will require hard work within all of the institutions that enable such violence today. Tamika Butler, a leading voice for racial justice in the transportation world, put it best: “Bicycling cannot solve systemic racism in the United States. But systemic racism can’t be fixed without tackling it within bicycling.” I hope that we can all be part of that solution.


Jesus M. Barajas is Assistant Professor in the Department of Environmental Science and Policy at the University of California, Davis. He teaches courses on environmental justice and his research focuses on transportation equity.

Impacts of the COVID-19 Pandemic on Transportation Use: Updates from UC Davis Behavioral Study

Less Bus and More Car Use During COVID-19

Mobility has changed during the COVID-19 pandemic. With social distancing and people working from home, travel has decreased significantly. However, as the economy has started to reopen, single-occupant car travel and bicycling have increased, while the use of public transit, ride-hailing, carpools, and shared e-scooters remains low.

At the 3 Revolutions Future Mobility Program of UC Davis, we are investigating the temporary and longer-term effects of the COVID-19 pandemic on transportation. Our current research project features online surveys and phone interviews focusing on how people are adjusting to the pandemic in terms of household size and organization, work activities, and transportation use. So far, we have data from more than 11,000 survey respondents in the US and Canada. Many of them participated in our previous mobility surveys, so we can compare their responses to see how the pandemic has changed people’s activity organization and travel choices. Findings from the study help us understand how the pandemic is disrupting transportation (and society) and inform policies to minimize the negative effects and promote more desirable equity and environmental impacts.

Telecommuting – Disparities

As would be expected by the nature of work that can be done remotely, higher-income workers are more likely to have started telecommuting during this time. Prior to the pandemic, only 8% of respondents telecommuted every day of the week, independent of income level. During the pandemic this share grew to 50% for the high-income group but to only 20% of the low-income group. These numbers add up to the already unequal impacts on employment, as low-income workers more often report that they have lost their jobs or have been furloughed without pay during the pandemic. The differences are even starker if we compare occupations. The adoption of telecommuting has increased by nearly four times for white-collar workers but has remained unchanged for blue-collar workers. Lower-income workers are also more concerned about the economic impact of the pandemic than about its health impact, an additional indicator of the difficult challenges facing low-income workers.

Increased Car Use, Less Use of Other Travel Alternatives

Comparing responses from 2019 versus 2020 shows a drop in the use of all modes of transportation. But 35% of those who are using less transit have also increased their driving. This is not surprising considering concerns about shared modes of travel; solo and family car travel is more compatible with social distancing. More concerning is that, this year, respondents are far less interested in adopting a lifestyle with limited car use or increased use of multiple transportation modes. In 2020, fewer respondents reported interest in forgoing car ownership, even if they had access to viable alternatives or could use or rent a car when they needed it. They were also less inclined to rely on Mobility as a Service (MaaS)—bundle subscriptions that provide access to transit, bikesharing, shared e-scooters, etc. When asked what they expected to do in the fall of 2020, about 60% of respondents agreed that they would drive their own vehicle more because it makes them feel safer from disease transmission, further signaling an increased reliance on private cars for the foreseeable future.

Ridehailing

The apparent impacts of COVID-19 on ridehailing, as provided by Uber and Lyft, again point to underlying inequities. Ridehailing was particularly popular among higher-income groups prior to the pandemic, but those respondents have significantly decreased their use of the service, which is in line with their ability to telecommute and their reduced social travel. On the other hand, ridehailing has remained more common among lower-income groups, who are less likely to work from home, often have limited access to a private vehicle, and are using transit services less frequently.

Walking

Both before and after the onset of the pandemic, a significant number of our respondents (40%) said  they never take leisurely walks, yet the number who walk every day increased from 10% prior to the pandemic to 16% during the pandemic. In addition, the study suggests that those who seldom walk are increasing their activity levels. This is one silver lining in an otherwise troubling time, and we should take advantage of the momentum gained during the pandemic to solidify these healthy habits in the community. Our colleague at UC Davis, Susan Handy has also written about the increase in bicycling during this period.

Policy Implications

The current increase in car use and decrease in the use of alternative, shared modes of transportation raise important policy questions about how to manage future transportation needs while addressing the equity and environmental side effects of the pandemic. Working from home and social distancing have decreased overall travel, but transportation needs remain, especially among those with lower incomes. As transit fare revenues continue to decline, the challenge of funding public transportation will only become more difficult. Further, the increased reliance on cars makes the shift to low- or zero-emission vehicles even more important (assuming the primary energy mix for electricity production is clean, as is the case in California). In addition, now is a time for cities and agencies to promote solutions and provide incentives that can further increase walking and bicycling, for leisure or for transportation. Potential actions include judicious expansion of open streets, as discussed in our previous blog. The highlighted equity issues should also compel policymakers to develop programs to assist the most vulnerable—to ensure that they are not further affected in this time of disruption—and mitigate existing inequities. In the transportation sector, this means providing access to as many safe transportation options as possible, including for those that do not own a vehicle, and ensuring that nobody is left behind.

The COVID-19 data described above was collected between April and July 2020. Previous mobility surveys were conducted in 2018 and 2019. Additional rounds of data collection for this project are planned for Fall 2020 and Spring 2021. More information is available at postcovid19mobility.ucdavis.edu and in the recorded webinar from July 15, 2020.


Giovanni Circella is the Director of the 3 Revolutions Future Mobility Program at ITS-Davis and the UC Davis Honda Distinguished Scholar for New Mobility Studies.

Rosa Dominguez-Faus is the Program Manager for the 3 Revolutions Future Mobility Program at ITS-Davis.